| URLs in this document have been updated. Links enclosed in {curly brackets} have been changed. If a replacement link was located, the new URL was added and the link is active; if a new site could not be identified, the broken link was removed. |
![]()
Ecology Articles in Google Scholar: Levels of Access to Articles in Core Journals
Auburn University
Auburn, Alabama
chrismc@auburn.edu
Abstract
Eight-hundred forty articles from core ecology journals were searched in Google Scholar (GS) to determine level and completeness of indexing and access. Testing occurred both on campus and off, and within each venue searching was divided evenly into basic and advanced modes. Off campus, about nine percent and on campus, about thirty-eight percent of links led to text that could be opened directly, without barriers. Fifty-seven percent of test articles had full citations or better, and over seventy-seven percent had at least some type of completable citation. Older articles were less likely to be represented. Full-text articles were concentrated at author sites and at a small number of provider sites. The advanced search found somewhat more full text than did the basic search. Highly cited articles were more likely to be included in Google Scholar.
Introduction
Google Scholar (GS) presents a challenge to libraries. Will it capture a wide audience and provide effective access to the scholarly record? Librarians need to understand its capabilities to be able to report objective findings to their clientele. They also need to know how much and what type of support to provide. Ecology is a promising discipline with which to test it because of the widespread interest in this field at all types of academic institutions.Talja and Maula (2003) reported that environmental scientists found their information by keyword searching of databases and electronic journals, chaining (i.e., following citations), sharing information in research groups, and scanning core journals. They used electronic materials readily and seldom visited the library. Ten Finnish scientists were highly satisfied with Current Contents. Haas, et al. (1999) used five other discipline-based abstracting services to convincingly show significant variation in core coverage among these services at both the journal and article level. In other words, depending on one abstracting service is a mistake. Since Google Scholar supports both keyword searching and following citations, ecologists may be predisposed to accept Google Scholar.
Notess (2005) provided a clear summary of the Google Scholar's search engine's basic features at the time of this study. The search engine's aim is to provide access to scholarly material in a variety of formats, such as peer-reviewed articles in preprint or published state, technical reports, abstracts, theses, and books. It does this by using the same indexed pages as its parent Google, but by ranking them with an eye to bringing the most important scholarly material to the top. Among the ranking factors are what kind of site has cited an item and how often it has been cited.
Myhill (2004) and Jacsó (2005) have pointed out the small and unpredictable subsets of known material it successfully indexes. The present investigation focuses solely on peer-reviewed articles, including review articles. Important questions to answer are: How much of the core literature is covered and at what level? How well does GS cover the oldest and most recent material? If a library decides to support access through GS, where should it focus its efforts? Are the most-cited articles included? This preliminary study attempts an exploration of these issues.
Librarians are aware of the difficulties in determining what can by found, as well as of the greater difficulties in determining what cannot, through search engines. Indexing is extensive, intensive, and imperfect. Important items may be retrieved but ranked so far from the top they remain undiscovered. Indexed pages disappear or are reincarnated in other forms. Orthographic variants and human error abound.
Methods
Journal and Article Selection
Two lists of ecology journals were used in the determination of the data set. First, the core ecology journals selected for cover-to-cover indexing in the Cambridge Scientific Abstracts Serials Source List for Ecology Abstracts were entered into a relational database. These journals were considered so central to ecology that the editors of CSA chose to include all their articles, not just selected relevant items, in Ecology Abstracts. Next, the list of ecology journals from the JCR: Journal Citation Reports 2003 (2004) was compared with the first list. While the variability of ecology journal impact factors from year to year within the JCR is significant, (Altmann & Gorman 1998) mere inclusion in the rankings indicates these journals are among the most prestigious. Only journals found on both lists were selected for the study. Ceased titles were removed. No attempt was made to follow title changes back through time. Forty-six journals remained. In this manner a current list of journals considered important by two major abstracting services was obtained. Appendix A lists the journals.Note that this list excludes journals of great importance but of more general character, such as Nature and Science. While any ecologist certainly would think these important, the focus here was on the core journals of a specific discipline. The goal was not to determine a definitive list of the most important ecology journals, but rather to produce a set that should be included in any reputable index claiming to cover that subject.
The 86,774 articles from these journals indexed in the Web of Science 1945 to March 2005 were identified. A random sample of 840 was selected by SPSS. This number was considered sufficiently large to allow for a large null set (articles not found at all in Google Scholar), yet small enough to study in a naturalistic setting. By naturalistic is meant a setting in which humans, not machines, perform plausibly "real-life" searches in Google Scholar. The 840 items were expected to be sufficient to accommodate analyses by factors such as date and level of access. Preliminary testing led to the decision to record only most complete level of access found, in that attempting to record all possible levels would be unmanageable and confusing.
Search Strategy
Thorough pretesting developed a search strategy designed to be careful but efficient. Spink et al. (2002), have confirmed the continuing patron habits of looking only at the top items and of performing simple searches. The strategy for the data collection acknowledged this but attempted to give GS every reasonable opportunity to unearth a document. Despite the findings of Spink et al., half the searches were performed in the advanced search mode in order to compare it with the basic search.The sample was further divided by SPSS into two categories to vary the search location. Four hundred twenty were searched on the campus of a large academic institution and 420 off campus using no login ID's or passwords. At each of these two locations, half, or 210, articles were searched in the basic GS search mode, and half in the advanced mode. At the time of the data collection no effort had been made by the library to enhance access through GS.
For each article, up to three different types of searches were employed. These three may be simplistically designated title, author-title, and author-journal. Up to thirty of the top links found by each search were investigated and evaluated. When a link opening the full text was found, the search for that article stopped. If no full text appeared the search continued until all steps of the three types of searches were completed. The most complete result was recorded in an Excel spreadsheet.
During the title search, the title of an article was pasted into the search form, inspected for problems, and then searched. If more than thirty links were found, the search was revised as described below. Next, an author-title search was performed which included the last name of the first author and the title of the article. Third was an author-journal search consisting of the last name of the first author and the unabbreviated journal name, without subtitles. In the GS advanced search the separate data wells available for keyword (labeled "all the words"), author, journal, year, etc., were used.
Within each of the three search types it was necessary to correct for untoward situations such as giant or scanty answer sets. If over thirty items were retrieved in any search, another data element was added to the search. If three or fewer items were retrieved and none looked promising, words were removed and/or their variants were tried. For example, if a title search retrieved few items, words that were sometimes but not always hyphenated were deleted. Character strings with super- or subscripts might be removed. If an author-journal search retrieved over thirty items, the year of publication was added. Even so, great variation in answer set size occurred.
Constant vigilance was required to identify and overcome the numerous variants present in both the Web of Science, with its legacy Science Citation Index conventions, and in GS with its data "contributed" by individuals and publishers. Umlauts, double last names, chemical names, super- and subscripts, and transliterations all required thought. The varied search tactics proved useful. If an author's name presented diacritic problems, the title search might still identify the article. If a title's chemical or superscript elements defeated the title search, the author-journal search might uncover its presence. Table 1 shows example variants. Despite these efforts, retrieval failures must have occurred.
| WOS/GS Variants | |
|---|---|
| WOS | GS |
| Dendubbeldon | Den Dubbelden |
| Vanapeldoorn, RC | RC van Apeldoorn |
| WILTSHIR.GH | GH Wiltshire |
| Kuhl | Kuehl Kühl |
| Hjalten | Hjaelten Hjältén |
| H2S | H 2 S |
| H-3-thymidine | super (3) H-thymidine |
| CO2 | CO 2 |
| isotopes (delta N-15 and delta C-13) | isotopes ( delta super(15)N and delta super(13)C) |
Levels of Access
The results were recorded in spreadsheets with separate columns for each result level. After the data collection, the results were edited for uniformity and classified into the seven levels of access identified while searching:
- Direct: The searcher was able to follow logical links to open the full text without purchasing the item or inputting any login information. The same article thus could have very different access on or off campus. Articles to which the searcher had rights that opened on campus as well as open-access articles were included in this category.
- Barriers: The full text was apparently available by following logical links, but not without purchasing the item or inputting login information. Ingenta full-text articles were included in this category if they did not open immediately but required logging in or ordering. As in Direct access, the results for an article might vary on or off campus.
- Abstract: An abstract with a full citation could be opened without hindrance.
- Full Citation (FullCit): A full citation required at least the first author's last name, most of the article title (subtitles were not necessary), journal, volume, year, and first page. A Full Citation provided all this information in one place. Any identifiable journal title abbreviation was allowed. It is important to note that this category label did not match the GS designation "Citation," which by no means meant a complete citation. The GS label "Citation" indicated that the article had been cited by another article, and as such was classified in items five or six below.
- Completed Partial Citation (Prt1): The items labeled "Citation" by GS were invariably only partial citations gleaned from bibliographies of other articles or similar locations. When a GS-labeled "Citation" appeared in an answer set, the "Web Search" link was followed. (Preliminary testing had indicated that for the purposes of this experiment "Web Search" was more useful than GS's "Cited by...") If missing parts of the citation found on any of the other thirty items added up to a full citation as defined in number four above, the item was classified as Completed Partial Citation. Other items that were not labeled "Citation" but provided the same amount of information were also included here.
- Partial Citation, Not Completed (Prt0): When a GS-labeled "Citation" appeared in an answer set and the procedure in number five above (Completed Partial Citation) failed to uncover missing information, it was classified as Partial Citation, Not Completed. Other items that were not labeled "Citation" but provided the same amount of information were included here.
- Nothing: This category contained items not found. Also included here were small fragments that appeared to be the item sought but lacked enough data to quality for "Partial Citation, Not Completed" or better.
Results and Discussion
Level of Access by Location (On or Off Campus)
Figure 1 shows the level of access by location from which the search was done.
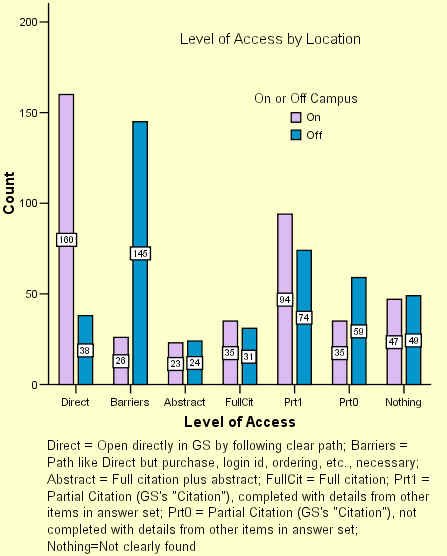
Figure 1. Level of Access by Location. N=840
The clustered bar chart shows decreasing levels of access categories from left to right, and within each category on-campus access is the left bar, and off-campus is the right.
Most striking is the extreme difference in access between on campus and off in the Direct and Barriers categories. The 160 of 420 items accessed without hindrance within the large academic library used for this study contrasted sharply with the thirty eight accessible from the author's workstation at home. The thirty eight were almost entirely from author sites. Not surprisingly, the Barriers class reversed the relationship, with only twenty six on campus and 145 at home.
As expected, similar numbers of items at the Abstract, Full Citation (FullCit), and Nothing levels were found each on campus and off. Abstracts (twenty three found at work, twenty four at home) were generally found at publisher sites and tended to point to older articles not yet available on the Internet. Full Citations were found as parts of complete documents, tables of contents, or bibliographies.
A large difference (x2 = 8.45, df=1, N=840, sig .00) was found between on campus and off in the partial-citation categories, Prt1 (completed) and Prt0 (not completed). Ninety-four Prt1 citations were found on campus as contrasted with seventy four off. That is, only about seventy-nine percent of the number of Prt1 citations identified on campus were found off campus. An even greater difference but in the opposite direction was found between Prt0 items, thirty five at work and fifty nine at home.
Why might this be? Combining Prt1 and Prt0 on and off campus resulted in groups of similar size, 129, or 30.71%, on campus, and 133, or 31.67%, off campus. Therefore the larger sample seems divided evenly. It is possible that being on campus allowed more completion of partial citations through the greater number of links leading to full text on campus. These full-text items then could supply information to complete via their bibliographies the missing parts of the originating citation. Unfortunately, the method of recording data did not allow for testing this interpretation after the fact.
Notice the typical GS "Citation" in figure 2.
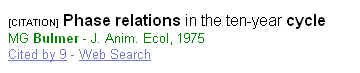
Figure 2. Google Scholar "Citation"
Consider what would happen if some morning Cambridge Scientific Abstracts or Biological Abstracts suddenly started displaying citations with as little information as our sample GS "Citation." Indignant emails would erupt across the globe. It is a generous definition of completed citation (Prt1) to include material whose parts had to be extracted from among thirty items. Prt0 would not begin to satisfy the users of standard science databases. If GS were held to the same standard of citation identification as traditional databases, over thirty percent of the total sample (Prt1 and Prt0) would have to be moved from partially found to not found. GS deliberately included these Citations, presumably with the expectation that following the "Cited by" links would resolved any ambiguities, which indeed, could happen if no barrier existed between the user and the full document. Their parallels in such databases as the Web of Science, however, usually include author initials, volumes, and beginning page numbers.
For someone desiring to find the article in figure 2, important elements are missing. Such items moved from the Prt0 class to the Prt1 only when other items in the same top-thirty answer set provided volume, first page, and/or other missing data. Otherwise the item remained in the Prt0 category. Researchers wanting to complete the citation would have to find the missing elements elsewhere. Allowing citation completion from other items in the answer set was generous enough in the measure of the database. Another approach, clicking on the "Cited by..." GS link, had so frequently in the pretesting led to items behind barriers that it had been discarded. Even while it seemed appropriate to give a new database every opportunity to succeed, rating the Prt0 items more highly seemed unreasonable.
Table 2. Level of Access
| Access Level * On or Off Campus | ||||||||
|---|---|---|---|---|---|---|---|---|
| On | % On | Selected Agg. % | Off | % Off | Selected Agg. % | Total | Both Cum. % | |
| Direct | 160 | 38.10% | Direct & Barriers: | 38 | 9.05% | Direct & Barriers: | 198 | 23.57% |
| Barriers | 26 | 6.19% | (186) 44.29% | 145 | 34.52% | (183) 43.57% | 171 | 43.93% |
| Abstract | 23 | 5.48% | 24 | 5.71% | 47 | 49.52% | ||
| FullCit | 35 | 8.33% | 31 | 7.38% | 66 | 57.38% | ||
| Prt1 | 94 | 22.38% | Prt1 & Prt0: | 74 | 17.62% | Prt1 & Prt0: | 168 | 77.38% |
| Prt0 | 35 | 8.33% | (129)30.71% | 59 | 14.05% | (133)31.67% | 94 | 88.57% |
| Nothing | 47 | 11.19% | 49 | 11.67% | 96 | 100.00% | ||
| Total: | 420 | 100.00% | 420 | 100.00% | 840 | |||
Table 2 shows that the on-campus portion of the aggregated Direct/Barriers categories, those categories with the possibility of full text, exceeded forty-four percent, with the corresponding off-campus figure of slightly under forty-four percent. Some form of partial citation (Prt1 or Prt0) amounted to just over thirty percent. With over eleven percent not being found at all, that left only the small portions of abstracts (5.48-5.71%) and full citations (FullCit, 7.38-8.33%) to complete the possibilities. If held to the citation completeness expected of commercial databases, 57.38 % (FullCit or better) of the core ecology articles studied here could be found indexed in GS. With the looser standard of including Prt1 citations, 77.38% were found. Whether these results are impressive or disappointing depends on how one looks at GS, as a new and free endeavor or as a replacement for standard library indexes.
The rightmost column of Table 2 reveals the overall results. Nearly twenty-four percent, or 198, of the 840 articles could be opened without hindrance. Approximately forty-four percent (Direct and Barriers) could have been opened if a determined (and well-funded!) institution had somehow managed to subscribe to Internet versions of all articles, had provided Ingenta and other similar provider accounts to all users, and had overcome all network and login barriers. The 77.38% Prt1 or Better may be a generous but plausible estimation of the core ecology articles indexed in Google Scholar. If the Prt0 citations are included fully 88.57% of the sample had some presence in GS. Only 96 (11.43%) of the 840 were not found at all.
A closer look is warranted. Of the articles searched off-campus ("% Off" in Table 2) 9.05% percent could be opened directly; that is, the full text could be viewed. That is the percent that anyone with access to Google Scholar might have discovered. Contrast that with the 38.10% ("% On" in Table 2) that could be opened on campus at one large academic institution with the current normal library mix of electronic, print, and no subscription. The real difference between native off-campus access and the best full-text access possible would be the 35.24% difference between the 9.05% off-campus Direct and the Direct/Barriers 44.29% on campus. In other words, concerted institutional effort might make up to a 35 % difference for ecology.
Of course, the entire experiment focused on using GS. The remaining abstracts, citations, and both types of partial citations surely included articles for which the researcher's academic institution had rights. It would certainly be possible for someone to open another window and use the library catalog or web site to determine ownership.
Provider
Libraries planning to support access through GS need to know where to focus their energies. The 369 articles which had the potential to be accessed through GS, those in the Direct or Barriers categories, were classified by publisher or site. Because some were available through more than one link, 443 provider links were identified. Table 3 lists them in descending frequency.Table 3. Provider
| Provider | |||
|---|---|---|---|
| Frequency | Percent | Cumulative Percent | |
| Synergy | 87 | 19.6 | 19.6 |
| Springerlink | 78 | 17.6 | 37.2 |
| Author | 69 | 15.6 | 52.8 |
| Ingenta | 66 | 14.9 | 67.7 |
| JSTOR via ESA | 42 | 9.5 | 77.2 |
| Springerlink Archive | 17 | 3.8 | 81.0 |
| ESA | 14 | 3.2 | 84.2 |
| JSTOR | 13 | 2.9 | 87.1 |
| Inter-Research | 12 | 2.7 | 89.8 |
| Elsevier via Ingenta | 11 | 2.5 | 92.3 |
| Oxford | 6 | 1.4 | 93.7 |
| NZ Ecological Society | 6 | 1.4 | 95.0 |
| Cambridge | 4 | 0.9 | 95.9 |
| Synergy via NCBI | 3 | 0.7 | 96.6 |
| NCBI | 3 | 0.7 | 97.3 |
| Elsevier | 2 | 0.5 | 97.7 |
| Ecoscience | 2 | 0.5 | 98.2 |
| Earthscape | 2 | 0.5 | 98.6 |
| Evolutionary Ecology | 1 | 0.2 | 98.9 |
| Elsevier via PubMed | 1 | 0.2 | 99.1 |
| EGI | 1 | 0.2 | 99.3 |
| BioOne | 1 | 0.2 | 99.5 |
| Springerlink via PUBMED | 1 | 0.2 | 99.8 |
| 24hourscholar Findarticle | 1 | 0.2 | 100.0 |
| Total | 443 | 100.0 | |
Certain providers were divided into functional groups, notably Springerlink (Springerlink, Springerlink Archive, and Springerlink via PUBMED) and JSTOR (JSTOR and JSTOR via ESA (Ecological Society of America)) to more clearly delineate the path to the items.
Over half could be accessed through a combination of Synergy, the basic Springerlink, and author sites. Author sites were overwhelmingly located at educational institutions. If JSTOR, JSTOR via ESA, ESA, Ingenta, and the Springerlink Archive were added, 87% of articles could be accessed. It appears that systems and collection development personnel can focus their energies on a few providers to achieve significant access improvements in the area of ecology.
Date Coverage
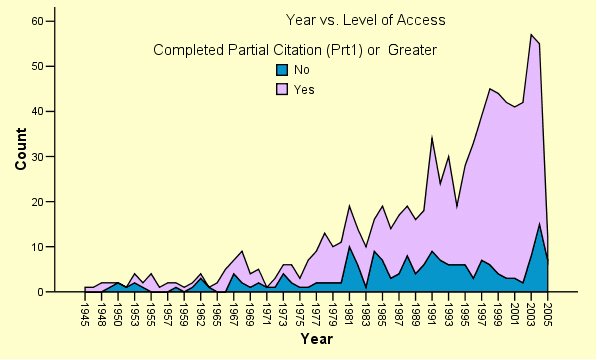
Figure 3. Year vs. Level of Access. N=840
Figure 3 illustrates change in access over time. The sample set itself contained a relatively small number of articles from the earliest years, reflecting the number of ecology articles indexed in Web of Science at that time. For the earliest decade, 1945-1954, a more or less even division between a filled partial citation or greater (Prt1 or Greater=Yes, the upper segment) and less access (Prt1 or Greater=No, the lower segment) can be seen. As the years progress an increasingly larger proportion of articles has Prt1 or greater representation. The data suggests that researchers should be concerned that valuable older material is lost by depending on GS alone. Of course, GS does make some attempt to cover that information, while certain commercial scholarly databases either make no attempt or require the purchase of archival files.
Since the original data capture occurred in March 2005, the 2005 sample contained only twelve articles, five of which had Prt1 or greater access and seven of which had less. This small number prevented a good test of the perception that GS lags in indexing recency, but the fairly even division suggests this issue should receive scholarly attention. Burright's (2006) preliminary findings also indicated a problem in this area. New articles by their nature lack citedness, either in the literature or on the Internet. Therefore they are at a disadvantage in being represented at the top of the GS search results. Further studies showing how well GS captures the very latest scholarly research are needed.
Table 4 aggregates the articles into decades, where the upward trend of representation can be seen numerically.
Table 4. Ten-Year Groups
| Ten Year Groups * Completed Partial Citation (Prt1) or Greater | |||||
|---|---|---|---|---|---|
| Count | |||||
| Prt1 or Greater? | Yes | No | Total | % Prt1 or Greater of Year Group | |
| Ten Year Groups | 1945- | 8 | 7 | 15 | 53.33% |
| 1955- | 11 | 6 | 17 | 64.71% | |
| 1965- | 31 | 17 | 48 | 64.58% | |
| 1975- | 76 | 36 | 112 | 67.86% | |
| 1985- | 150 | 60 | 210 | 71.43% | |
| 1995- | 369 | 57 | 426 | 86.62% | |
| 2005 | 5 | 7 | 12 | 41.67% | |
| Total | 650 | 190 | 840 | 77.38% | |
Basic or Advanced Search
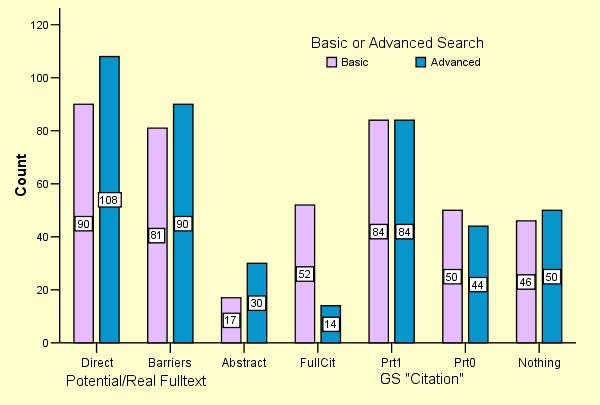
Figure 4. Basic or Advanced Search. N=840
While comparing basic and advanced searching was not the major thrust of this paper, the results, seen in Figure 4, should pique interest. The lesser access categories were more or less evenly represented in the division between basic (the left column in each group) and advanced (the right column in each group). The advanced search seemed to do somewhat better than the basic in the higher categories of direct, barriers, and abstract. This might seem counter-intuitive to those who expected that using the data wells of the advanced search would limit the locations GS would look for those character strings and result in lower recall. Instead, the correct characterization of the citation elements appears to have brought better links to the top. These results do show that suggesting patrons use the advanced makes sense, despite the unlikelihood of their actually doing so. Since both groups had 420 articles, the FullCit category, with 52 basic items and only 14 advanced, is where the basic search appears to have made up the counts "lost" in Direct, Barriers, and Abstract categories. In other words quite a few of the 52 basic-search FullCit articles might have been found at more complete levels had they been searched in the advanced mode.
Inclusion of Highly Cited Articles
Within each journal will be articles of varying citedness. One of the aims of Google Scholar is to display highly cited articles near the top of the results set. Figure 5 demonstrates one method of testing whether GS succeeded.
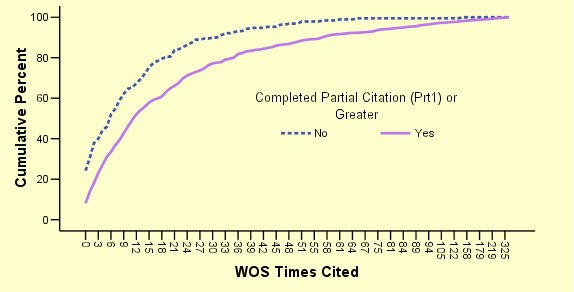
Figure 5. Cumulative Percent Frequency Distribution, Completed Partial Citation (Prt1) or Greater vs. Lesser Access
Figure 5 shows two cumulative percent frequency distributions. The lower, solid line ("Yes") on the figure represents those items from the sample set found in GS at the Prt1 or greater level. The higher, dotted line ("No") represents those that were not. This latter group contains both Prt0 and Nothing items. The x axis groups the articles into how many times they have been cited in the Web of Science (WOS), but cumulatively. For example, above "12" the solid line shows the percent of Prt1 or greater citations that have been cited twelve or fewer times. The dotted line above "12" shows the percent of Prt0 or Nothing citations that have been cited twelve or fewer times. Counter-intuitively, in this type of graph the lower line is the better-cited group. The "No" line rises faster at the low-cited, left end of the chart. A larger portion of its articles can be found in the low-cited group. The Prt1 or Greater ("Yes") solid line rises more slowly. A greater portion of its articles are counted among the more highly cited articles on the right. (sig .000. See table 5.) From this one can see that the designers at GS have indeed succeeded in bringing the more highly cited material to the top of their answer sets.
Table 5. KS Test of Independence, Prt1 or Greater vs. Lesser Access
| Frequencies | ||
|---|---|---|
| Prt1 or Greater | N | |
| WOS Times Cited | 0 (no) | 190 |
| 1 (yes) | 650 | |
| Test Statistica | ||
|---|---|---|
| WOS Times Cited | ||
| Most Extreme Differences | Absolute | .197 |
| Positive | .000 | |
| Negative | -.197 | |
| Kolmogorov-Smirnov Z | 2.394 | |
| Asymp. Sig. (2-tailed) | .000 | |
Was it important for GS to include what it calls "Citations" (here called partial citations (Prt0 and Prt1)) to achieve this? The answer seems to be yes. Figure 6 shows the comparative cumulative percent frequency distribution of the articles divided differently, this time into FullCit or greater versus lesser access levels (Prt0, Pr1, and Nothing). The lines are reversed. This time the solid "Yes" line lies higher on the graph. The "No's" lie below it on the left side of the graph, and thus have a higher level of citedness than the "Yes's." (sig .000. ,See table 6.) The material with better access was cited less intensely. This remained true all for other higher comparisons, the Direct only, Barrier-or-higher, and Abstract-or-higher groupings.
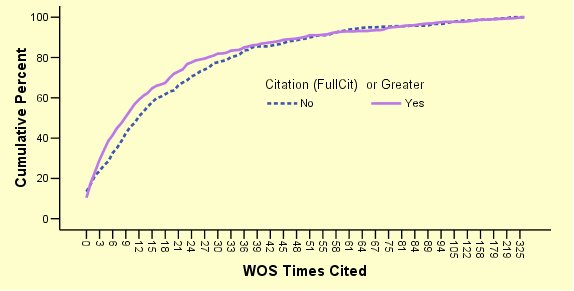
Figure 6. Cumulative Percent Frequency Distribution, Citation (FullCit) or Greater vs. Lesser Access.
Table 6. KS Test of Independence, Citation (Fullcit) or Greater vs. Lesser Access
| Frequencies | ||
|---|---|---|
| Citation (Fullcit) or Greater | N | |
| WOS Times Cited | 0 (no) | 358 |
| 1 (yes) | 482 | |
| Total | 840 | |
| Test Statisticsa | ||
|---|---|---|
| WOS Times Cited | ||
| Most Extreme Differences | Absolute | .101 |
| Positive | .101 | |
| Negative | -.030 | |
| Kolmogorov-Smirnov Z | 1.447 | |
| Asymp. Sig. (2-tailed) | .030 | |
Why might this be? Items were included in the Prt1 or Prt0 category only if someone had cited them. Reasonably, one would therefore expect them to have overall higher citation counts in the Web of Science. (Pauly & Stergiou 2005, attempt to demonstrate this, but with a small and peculiarly chosen sample.) The publishers with more complete access to their journals included perforce both cited and uncited articles. The inclusion of the items GS calls "Citation," here called Prt0 and Prt1, provided a means for GS to succeed in reaching its goal of including the more highly cited material at the cost of the usefulness of many entries. Ironically, as the proportion of highly cited material goes down, the overall access level improves.
Weaknesses of the Study
The Web of Science, from which all sample articles were extracted, focuses on English-language, Northern European, and North American journals. The base data set therefore does not adequately test GS's ability to index information in other languages and from other regions. Mueller's (1992) list of international, i.e., non-Brazilian, periodicals of greatest interest to Brazilian ecologists only shares eighteen of 43 still-current periodicals with the sample journal list. While some of this was due to the more general nature of her list, it could also suggest that the articles used in this study might not have been entirely representative of international interests.Only articles were searched. GS aims to include the other standard formats of scholarly literature. Reports, conferences proceedings, data sets, and other material are important to ecology. Further studies are needed to evaluate these types.
Care should be taken not to generalize too readily these findings to other disciplines. Reference lists of ecology articles typically include the article title. Other disciplines such as chemistry do not. This could alter the relative proportions of the access levels, although the author-journal search types should have ameliorated this difficulty.
The sample set did not have enough current-year journals to adequately test recency. Studies, probably a variety addressing this issue, are needed.
Conclusions
Depending on one's definition of a complete citation, GS indexed between fifty-seven and seventy-seven percent of the articles from the sample core list of journals. If GS is held to the standard, of, say, the Cambridge Scientific Abstracts, about half the articles from the sample were found. This can be interpreted as an automation tour de force for a new database or as a shocking failure to include basic material. The nine percent that could be opened from off campus may be one indication of what portion of significant scholarly ecology journal literature is available open access. Far from providing equal-opportunity access to information, GS provided better access to the literature for those working on a campus with a well-financed academic library than it did for the world in general. In this specific instance it provided a larger proportion of full-text articles than articles behind barriers, and a larger proportion of completable partial citations instead of incompletable ones. As for date coverage, early years are not covered as well as more recent ones. The very latest articles may not be indexed well. In addition to authors' sites, a small number of publisher sites provided the bulk of the successfully indexed items.Google Scholar over time will include additional material as it continues to rank the pages indexed by Google. The mix of different levels of access may change. This is a complex issue, in that each scholarly article added is likely to include numerous cited items. Author sites, abstracts, and full citations will be added. If most of the newly indexed articles are new chronologically and the articles they cite are older, what will this do to the year and access level mix? Or have the characteristic proportions already been achieved?
A few observations remain. Should libraries support access through GS? Libraries paying large sums for Biological Abstracts, Web of Science, and CSA databases may rightly believe their patrons should be pointed to these. Just as many biochemists have developed a habit of using PubMed despite a library's provision of expensive licensed databases, so might ecologists develop a habit of using Google Scholar. It exists within an environment they use daily, is easy to search, and often succeeds in providing a good-enough answer. The in-depth indexing may retrieve data not easily accessible through standard abstracting services. Since it will be used, the decisions libraries have to make are only in what ways and at what level we should support Google Scholar.
References
Altmann, K.G. and G.E. Gorman. 1998. The usefulness of impact factors in serial selection: a rank and mean analysis using ecology journals. Library Acquisitions: Practice & Theory 22(2):147-159.Burright, M. 2006. Google Scholar -- Science & technology. Issues in Science and Technology Librarianship, Fall 2006, Number 45. [Online]. Available: http://www.istl.org/06-winter/databases2.html [June 20, 2006].
Haas, S., C.W. Lee, and A.L. Battiste. 1999. Ecology and ecosystem management: core journals and indexes. Science & Technology Libraries 18(1): 3-24.
Jacsó, P. 2005. Google Scholar (redux). Peter's Digital Reference Shelf, June 2005. [Online]. Available: {https://web.archive.org/web/20060616120045/http://www.gale.com/servlet/HTMLFileServlet?imprint=9999®ion=7&fileName=/reference/archive/200506/google.html} [July 4, 2006].
JCR: Journal Citation Reports 2003. 2004. Philadelphia: Institute for Scientific Information.
Mueller, S. P. C. 1992. Periódicos estrangeiros prioritários para o ensino e a pesquisa da ecologia no Brasil. Ciência da Informação 21(1):32-39.
Myhill, M. 2004. Google Scholar. The Charleston Advisor, April 2005, 6(4). [Online]. Available: {http://www.charlestonco.com/review.cfm?id=225} [July 2, 2006].
Notess, G. R. 2005. Scholarly Web Searching: Google Scholar and Scirus. Online 29(4): 39-41.
Pauly, D., and K.I. Stergiou. 2005. Equivalence of results from two citation analyses: Thomson ISI's Citation Index and Google's Scholar service. Ethics in Science and Environmental Politics 2005:33-35.
Serials Source List for Ecology Abstracts. Cambridge Scientific Abstracts. [Online]. Available: http://www.csa.com/ids70/serials_source_list.php?db=ecology-set-c [March 3, 2005].
Spink, A., et al. 2002. From e-sex to e-commerce: web search changes. Computer 35(3):107-109.
Talja, S. and H. Maula. 2003. Reasons for the use and non-use of electronic journals and databases; a domain analytic study in four scholarly disciplines. Journal of Documentation 59(6):673-691.
Appendix A
Journals Used to Select Sample
Acta OecologicaAdvances in Ecological Research
African Journal of Ecology
Animal Conservation
Aquatic Microbial Ecology
Austral Ecology
Basic and Applied Ecology
Behavioral Ecology
Behavioral Ecology and Sociobiology
Biodiversity and Conservation
Biological Conservation
Conservation Biology
Ecography
Ecological Applications
Ecological Modelling
Ecological Monographs
Ecological Research
Ecology
Ecology Letters
Ecoscience
Ecosystems
Ekologia
Evolutionary Ecology
Evolutionary Ecology Research
Functional Ecology
Global Ecology and Biogeography Letters
Journal of Animal Ecology
Journal of Applied Ecology
Journal of Biogeography
Journal of Ecology
Journal of Experimental Marine Biology and Ecology
Journal of Tropical Ecology
Journal of Wildlife Management
Landscape Ecology
Marine Ecology Progress Series
Microbial Ecology
Molecular Ecology
Molecular Ecology Notes
Natural Areas Journal
New Zealand Journal of Ecology
Oecologia
Oikos
Oryx
Plant Ecology
Population Ecology
Restoration Ecology
| Previous | Contents | Next |
