Metrics and Science Monograph Collections at the Marston Science Library, University of Florida
Michelle F. Leonard
Science & Technology Librarian
mleonard@uflib.ufl.edu
Stephanie C. Haas
Science, Digital & Open Access Librarian
haas@uflib.ufl.edu
Vernon N. Kisling
Chair & University Librarian
vkisling@ufl.edu
Marston Science Library
University of Florida
Gainesville, Florida
Abstract
As academic libraries are increasingly supported by a matrix of database functions, the use of data mining and visualization techniques offer significant potential for future collection development and service initiatives based on quantifiable data. While data collection techniques are still not standardized and results may be skewed because of granularity problems, faulty algorithms, and a host of other factors, useful baseline data is extractable and broad trends can be identified.
The purpose of the current study is to provide an initial assessment of data associated with science monograph collection at the Marston Science Library (MSL), University of Florida. These sciences fall within the major Library of Congress Classification schedules of Q, S, and T, excluding TR, TT, and TX. The Rs are also excluded as these subjects are the responsibility of the Health Science Center Library which is connected with the medical school and the teaching hospital.
The overall strategy of this project is to look at the potential science audiences within the university community and analyze data related to purchasing and circulation patterns, e-book usage, and interlibrary loan (ILL) statistics. This paper presents the results from the academic year July 1, 2008 to June 30, 2009, because all data reservoirs needed were available for the circulation and ILL data. The Springer e-book study is based on 2009 data. The research team consisted of both librarians and technical support staff from MSL, the Acquisitions Department, the Cataloging Department, and the IT Department.
Potential Science Audiences of the Marston Science Library, 2008-09
In 2009, a science cataloger began defining the research constituencies at the University of Florida by college. These figures have been revised by the UF Office of Institutional Planning and Research (OIR), by defining faculty based on FTE and emeritus only. Marston Science Library has primary responsibility for serving the university community defined by two colleges: Agriculture and Life Sciences and Engineering, and for seven departments within the College of Liberal Arts and Science (CLAS): Astronomy, Biology, Chemistry, Geological Sciences, Mathematics, Physics, and Statistics. Data related to the CLAS departments was also obtained. The total population is 16,609: 5,339 in Agriculture and Life Sciences; 7,979 in Engineering; and 3,291 in the 7 CLAS departments.
Table 1. Potential Science Monograph Users by College, 2008-09
| Research Constituencies by College | Undergrad | Graduate | Faculty* |
|---|---|---|---|
Agriculture And Life Sciences |
3,853 |
937 |
549 |
Engineering |
4,984 |
2,692 |
303 |
CLAS: Astronomy |
28 |
30 |
22 |
CLAS: Biology/Botany/Zoology |
1,216 |
41 |
43 |
CLAS: Chemistry |
666 |
283 |
50 |
CLAS: Geological Sciences |
50 |
44 |
17 |
CLAS: Mathematics |
216 |
94 |
48 |
CLAS: Physics |
119 |
138 |
57 |
CLAS: Statistics |
64 |
51 |
14 |
*Official CLAS faculty count from Office of Institutional Planning and Research, UF, 3/2010.
Chart 1. Comparison of Users by College, 2008-09
The CLAS population is a total of the undergraduates, graduates, and faculty in the seven science departments delineated above.
Chart 2. Potential Users in the Seven Departments of the College of Liberal Arts & Sciences (CLAS)
Potential Audiences: Discussion
As expected, the undergraduate populations in the two colleges and seven CLAS departments are the largest potential audiences, with the number of undergraduates in each discipline ranging from 28 in astronomy to 4,900 in engineering.
In terms of total potential users, Astronomy has the smallest number 80, while both Statistics and Geological Sciences have less than 150. Mathematics and Physics each have 300+ potential users, Chemistry 1,000, and Biology/Botany/Zoology 1,300. The College of Agriculture has over 5,300 potential users, and Engineering has close to 8,000.
Science Monograph Circulation Profile, 2008-2009
From the online catalog supported by an ExLibris platform, 2008-09 circulation statistics were pulled for the Q, S, and T classes. The LC class/subclass listings for Q, S, and T are given in Appendix 1. Data of particular interest relate to User Groupings: Faculty, Graduate, Staff, and Undergraduate; the publication years of monographs circulated; and usage by LC Class which corresponds in general to the research subjects and classes taught in the various colleges and departments.
During the academic year, 13,874 unique items circulated: 1,621 to faculty, 8,057 to graduates, 374 to staff, and 3,821 to undergraduates. 2,916 multiple circulations did occur but only the last circulation can be associated with a particular user category so for the purposes of this study the last circulation counts are used. While staff activity is represented in the visual data presentations, they represent less than 3% of the circulation counts and no further consideration of staff collection interactions are included beyond circulation counts. Circulation of reserved textbooks and laptop computers are not included.
The date range of items circulated in 2008-09 covered a period of approximately 192 years from 1817 to 2009. 64% of the circulation, or 8,865 items, were published in 1990 or later. Items published in 1983 or later accounted for 80% of the circulation. Figure 3 indicates circulation by user group and year of publication for the past 20 years.
Chart 3. Circulation by User Group and Date of Publication.
Charts 4, 5, and 6 below display a more detailed breakdown into subclass areas for the Q, S, and T circulations with the analysis based on user groupings.
Chart 4. Circulation by User Group for Subclasses of Q (Science)
Chart 5. Circulation by User Group for Subclasses of S (Agriculture)
Chart 6. Circulation by User Group for Subclasses of T (Technology)
Circulation Profiles: Discussion
In terms of all subject areas, except three: fisheries (undergraduate 43; graduate 37), zoology (undergraduate 365; graduate 315), and chemical engineering (undergraduate 237; graduate 261), graduate student borrowing far exceeds borrowing of either faculty or undergraduates.
When all user populations are totaled, 10,300 items in the Q class circulated, 1,300 in the S class circulated, and 4,000 items in the T class circulated.
By relating the colleges and their departments to allied LC subclasses, evidence of science-wide usage patterns can be discerned. In the broadest terms, the Qs cover the science departments found within the College of Liberal Arts & Sciences, namely astronomy, biology, botany, chemistry, geological sciences, mathematics, physics, and statistics. The Ss cover Agriculture, and the Ts cover the engineering disciplines.
Within the Q subclasses, the highest graduate student borrowing rates were in QA Mathematics (1,800) followed by QC Physics (700), QD Chemistry (650), and QH Natural History/General Biology (600).
Within the S subclasses, the highest graduate student borrowing rate were in SB Plant Culture (300) followed by S Agriculture (General) (250).
Within the T subclasses, the highest graduate student borrowing rate was in TK Electrical Engineering (775) followed by TA Civil and General Engineering (600).
Having identified subclasses with high graduate student circulation rates, further topical granularity would make the metrics more meaningful and allow comparisons to monograph purchasing decisions. TagCrowd, an online word/tag/text/cloud application created by Daniel Steinbock, was used to analyze and visualize the call numbers of circulated items. This application is available for non-commercial use under Creative Commons licensing as of publication.
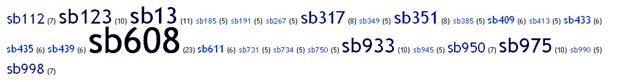
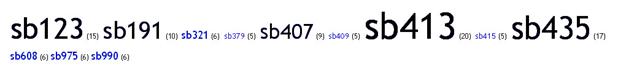
To demonstrate the efficacy of this visualization method, the two word clouds below show comparative undergraduate/graduate call number use for plant culture (SB) monographs: Cloud 1 Graduates, Cloud 2 Undergraduates. In this instance, a distinct difference in borrowing patterns is noted. Call numbers with five circulations or more were included. Key call numbers are very easy to extract and reference against the LC class subject scheme (see Appendix 1). Appendix 2 contains eight word clouds for LC subject classes that have the highest monograph borrowing by graduate students. In analyzing the two clouds below, graduate students appear to be concentrating their reading on Pests & diseases (SB608); Plant culture (SB13); Biological control (SB933/SB975); and Propagation (SB 123). Undergraduates are reading in Plant Culture (SB413); Ornamental plants (SB435); and Propagation (SB123). By parsing the call numbers to include subclass designations such as SB608.S9 Pests and diseases of sugarcane a more granular analysis can be visualized, and indeed, may prove more informative. Appendix 2 contains eight word clouds for LC subject classes that have the highest monograph borrowing by graduate students.
Cloud 1. SB
Plant Culture monographs borrowed by graduate students (n=311)
Cloud 2. SB
Plant Culture monographs borrowed by undergraduate students (n=230)
Monographs Purchased and Their Circulation
The true test of whether an acquisitions plan is working is whether your intended audience checks out the monographs and journals selected for purchase. It is well established within the sciences that journals are at the core of all academic endeavors. Monographs, aside from the strategically critical reference tomes, are usually secondary to research but provide synthesized background knowledge on the findings and methodologies of established repute. They also are invaluable as introductions to the panoply of scientific endeavors over time.
Part of the goal of the current study was to look at monograph purchases in light of borrowing patterns. To extract purchasing data for 2008-09, the ALEPH acquisitions serials module was searched by funding codes of each of the science subject disciplines. This type of data gathering is derived from multiple sources and is quite tedious. For example, the fund codes were run against the SQL purchasing database. The output produced a list of system Bibliographic Identification numbers that in turn were run against the online catalog Aleph Services report system to retrieve all the bibliographic data available. A macro was then run against the complete report to pull only those fields of interest which included: title, year, order number, barcode number. A Manage-70 report in the Aleph circulation module was used to convert the Bibliographic Identification numbers to item keys. These item keys were used to retrieve the circulation statistics for each item for 2008-2009. As noted, items purchased for reserve such as textbooks as well as reference books which do not circulate have been excluded from this analysis.
Chart 7 shows number of monographs purchased by fund code. These codes are managed by the science librarians, each of whom serves as a liaison to multiple science units on campus. In the broadest sense, these codes can again be correlated with LC classes. Chart 8 shows the titles purchased by LC classes.
Chart 7. Science Monographs Purchased by Fund
As indicated at the beginning of this paper, the sciences covered within the Marston Science Library are most closely allied with the Library of Congress classification categories Q, S, and T excluding TR, TT, and TX. A review of the monograph purchases indicated that a total of 1,206 monographs fell within the expected LC classes. A minimal amount of purchasing fell outside of these expected categories: within G (Geography/Geology) 39 monographs were purchased, 37 monographs were purchased from other classes including TX, R, HD, and F. Because the goal is to uncover broad purchasing and use trends, the 76 monographs falling outside the expected classes are excluded in further analysis. Chart 8 below shows monographs purchased within relevant LC classes.
Chart 8. Monograph Purchases by LC Class
Monographs Purchased: Discussion
Chart 7 shows purchases by subject and Chart 8 purchases by LC class with associated circulation numbers. These books were purchased either through firm order or through approval. Chart 8 compares purchases/circulations by LC classes: 1,200 purchases, 1,281 circulations. LC classes having circulation rates greater than purchases suggests that the new titles circulated more than once.
E-Resource Usage
Two separate studies were conducted on e-resource usage. The first study examined the print vs. e-book uses for titles purchased in 2008-09. Each of the 1,206 titles purchased was checked for an e-edition; 40 were found to be available online. Springer and MyiLibrary permitted searching of individual titles; Knovel provides only comprehensive total usage, and Books 24x7 would not respond to requests for logon access. Smaller online publishers National Academies Press, World Health Organization, and GSO e-book do not provide statistics.
The print copies of these 40 titles circulated 43 times while online usage was 431, or a 1000% increase. There were 157 uses of (QH) Molecular biomethods handbook, edited by John M. Walker and Ralph Rapley. Although comparisons between print and electronic copies are limited, the online usage is consistent with shifting information access patterns noted generally.
Chart 9
E-Resource Usage: Springer E-book Statistics
The second, more extensive study examines data available on Springer e-monograph usage during 2009. This usage was not compared to print edition usage, but was intended to identify general trends of e-book usage from one vendor. Of particular interest was comparable usage in the call number ranges identified earlier.
At UF, the call numbers in the Serials Solutions e-book MARC records are suppressed with the intent of lessening user confusion; however, this prohibits any systematic usage study based on LC class. To obtain call numbers for the e-book titles required the following steps: 1) Obtain a complete list of all Springer e-book titles available at UF. These listings usually include ISBNs; 2) Remove any titles that have not been checked-out: keep the unique titles and total number of usage hits; and 3) Create a "macro" program to match the e-book ISBN against the call number from OCLC (listed in our library circulation module). These steps produced an Excel spreadsheet of e-book titles and call numbers, verified the full e-book title against the OCLC call number, and allowed sorting by title and LC ranges of interest. Chart 10 only shows the LC subclass and number of uses in 2009 for Springer e-books.
Comparing e-book usage by LC classes parallels but amplifies the print circulation uses. The highest usage occurred in the QA mathematics/statistics range for print monographs and also in e-book usage where patrons viewed 2,126 unique titles, 10,538 times. These data are consistent with the high circulation rate, and Interlibrary Loan (chart 11) requests for this LC class. The second highest usage is the QH (natural history) range with 467 unique titles used 5,690 times. The third highest is the TK (electrical engineering) with 733 unique titles and 4516 uses.
Chart 10
E-Resources Usage: Discussion
The magnitude of e-book uses is staggering when compared to print uses. Comparing the number of potential borrowers in the science library with the number of items borrowed gives a very low use factor: namely, about one circulation per person per year. Logically, if online uses are treated as a measure of circulation, then uses would increase to 2.8 per person per year, still not a substantial usage. However, total 2009 Springer e-book usage for the 6,652 unique titles in Q, S, and T was 46,333, which means the average use per book was 7. Overall, the Q, S, and T titles and usage accounted for 73% of the total Springer usage.
As noted previously, the apparent vendor resistance to providing usage statistics will continue to confound library decision making. It can only be hoped that professional pressure will force e-book suppliers to reconsider this issue.
Analysis of ILL science book requests, 2008-2009
Chart 11: Books in the Q, S, T ranges requested via Interlibrary Loan by UF Patrons
ILL Profiles: Discussion
During 2008-2009, a total of 975 book requests were placed via Interlibrary Loan (ILL). Loan requests from faculty, graduate students and all off-campus (distance) UF patrons were analyzed. Patron status for distance borrowers was unavailable.
Total number of ILL requests: 975
Distance: 122 requests
Faculty: 205 requests
Graduates: 648 requests
Total number of requests by LC range:
Q: 540
S: 126
T: 309
Q's: A total of 540 requests were made by the three patron status groups: distance (75), faculty (129), and graduates (336) with the highest requests from graduates (86) for the QA range. Faculty also had the highest requests (47) for the QA range while the distance patrons made 18 requests for QH.
S: A total of 126 requests were made by the three patron status groups: distance (30), faculty (18) and graduates (78). Graduate and distance patrons borrowed materials in S; faculty in SB.
T: A total of 309 requests were made by the three patron status groups: distance (17), faculty (58), and graduates (234). Graduates and faculty requested in TA; distance patrons in the TD range.
Graduates have the highest request rates for both ILL and circulation. Similarly, within the Q classes, the QA range is the highest requested via ILL and circulation by graduate students. The S classes were least circulated and least requested via ILL; graduates requested ILLs in the S class, but borrowed books in SB. Graduate students used ILL to get books classed in T classes, but checked out books in TK.
Discussion
Despite the massive databases that underlie many of the academic library functions, extracting data to support evidence-based collection decisions remains convoluted, tedious, and incomplete. Nonetheless, the most telling figures lie in the comparison of the total circulation of 13,874 books (about 5% of the total MSL monograph collection of about 280,000 titles) and e-book usage from a much smaller title selection (6,674) of 46,527 uses.
While this study provides a first attempt to extract data related to monographic use, three other aspects need further research:
- In-house use of monographs needs to be recorded and analyzed. This is the focus of a library funded mini-grant that uses portable bar code scanners to scan bar codes of monographs that have been pulled by users but not checked out. The bar codes are then run against the online catalog to pull additional data. Results of this study should be available by August 2010.
- The high use LC subclasses need analyses at a greater level of granularity to provide clearer parameters for purchase whether in print or e-print format. The data extracted will be submitted to UF's institutional repository with appropriate metadata so that further analyses can be done by other researchers and librarians.
- E-books usage statistics need to be standardized and available on a per title basis, and the metadata needs to include LC call numbers and/or LC subjects to permit meaningful comparisons.
Conclusion
As material budgets continue to decline and e-resource availability expands, choosing the most appropriate monograph formats becomes increasingly important. Unfortunately, meaningful monograph use statistics are not easily obtained or analyzed, and the proliferation of e-titles without adequate usage measures confounds the problems.
This study has attempts to determine the types of statistics that can be retrieved related to monographic use in the science, engineering, and agricultural disciplines within the Marston Science Library, University of Florida. Measures identified for analysis included: potential users of science monographs, circulation statistics, interlibrary loan requests, and e-book uses. Simple visualization tools: Excel graphing functions and the Tagcrowd program, were used to help convey meaning from the findings. The process revealed that no data mining step is straightforward: multiple databases must be accessed and specific data fields stripped out and then reintegrated using macros. One of the most disconcerting findings was the lack of use statistics from online e-book vendors. In some cases, no data is provided; in others, total uses rather than title use is given. Frequently, e-book records fail to contain LC call numbers so macros again had to be created to pull the LC classes used in comparisons.
The results show different intensities of monograph use by patron categories, as well as defining call number areas of high patron interest. A significant finding is the use of monographs by graduate students, which far exceeds the use by undergraduates and faculty. In addition, there are specific subject areas (represented by LC subclasses) within each discipline that use significantly more monographs. Usage does not necessarily correspond to the student and faculty numbers in the related departments.
While it is reassuring to note that most monographs purchased were circulated, the phenomenal growth of e-book uses portends a continuing shift away from print. The ILL factor provides another measure of the need for monographic works. Having a purchase option that allows ILL to purchase, rather than borrow, titles is an effective user-centered method for identifying needed monographs.
While the authors recognize that greater granularity in LC class analysis will lead to better collection management decisions, this preliminary study provides basic methods to guide further explorations. The authors expect this study will form the baseline against which future studies can be compared. The ultimate goal is to provide quantifiable evidence that can be used to affect appropriate changes in budget allocations by subject areas and by format.
Acknowledgements
Jimmie Lundgren: Science Cataloger who originally compiled enrollment statistics and faculty numbers through various departmental web sites.
Jason Fleming: UF Libraries IT Department who created the macros needed to run the statistical data for the e-book usage.
Christian Poehlmann: UF Acquisitions Librarian who gathered the statistics for the e-book usage.
Departmental Statistics are provided by the Office of Institutional Planning and Research, 3/10/2010.
Appendices
Appendix 1: Library of Congress Classification Outline (PDF)
Appendix 2: Tag clouds for total and graduate borrowing of QA, QC, QD, QH, SB, TA, TK, and TP (PDF)
| Previous | Contents | Next |
