| URLs in this document have been updated. Links enclosed in {curly brackets} have been changed. If a replacement link was located, the new URL was added and the link is active; if a new site could not be identified, the broken link was removed. |
![]()
JSTOR's "Data for Research": A Bibliometric Analysis of Mathematics in Economics
Art King, Ph.D.
Economics Department
Brian Simboli, Ph.D.
Library and Technology Services
brs4@Lehigh.edu
Kevin Rom, M.S.
Economics Department
Lehigh University
Bethlehem, Pennsylvania
Abstract
The "Data for Research" (DfR) service facilitates bibliometric studies of key terms and phrases that appear in the full text of JSTOR articles. This platform provides faceted searches that supplement JSTOR's standard search engine, exemplifying how a full text data base enables data mining for the average end-user. We provide a comparison with existing full-text databases, illustrate the mathematization of economics, and suggest a few possible future enhancements.
Introduction
JSTOR's Data for Research (DfR), initially released January 2008 (Snyder 2010a), is available as a beta version as of July 2012. This freely accessible search engine enables full-text mining of nearly 8 million publications to meet new research requests received from researchers using JSTOR data (Burns, et al. 2009). JSTOR also plans to incorporate DfR's functionality into its pre-existing search engine in the next release of the latter. The type of data mining capabilities represented in JSTOR's database is now sufficiently important that the Association of Research Libraries (ARL 2012) stated "digitizing and indexing works for purposes such as statistical meta-analysis and search creates a powerful new scholarly resource that is not at all a mere substitute for the original work." Further, as Mitchell (2012) notes: "Community-managed sites like JSTOR's Data for Research demonstrate how a single data set can be made useful in new ways with a different interface." In this paper we discuss: likely users of DfR; how to use DfR; how it compares to the standard search interface and alternative text mining platforms; DfR versus the standard JSTOR interface; an example of its use involving the mathematizing of economics; four challenges when interpreting DfR output; and possible future enhancements. Comments in this paper concern DfR at the time of manuscript submission.
Potential Users of DfR
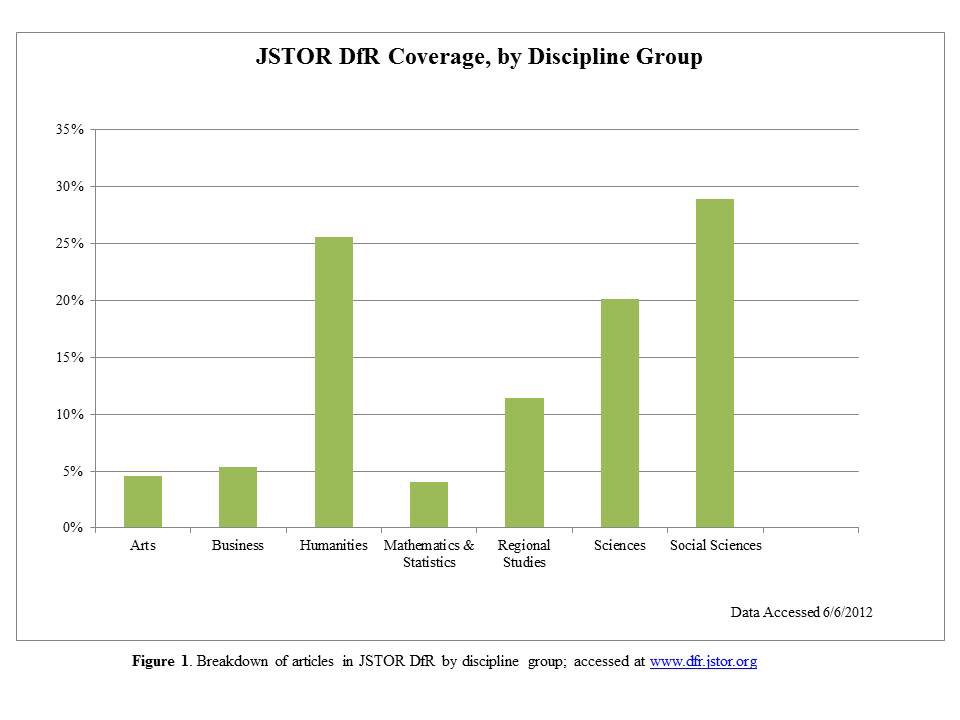
Users of DfR can apply its data analysis capabilities to a library of over 8 million unique book reviews, news, editorials, research articles, and other publications covering a wide variety of disciplinary areas. Figure 1 illustrates the distribution of JSTOR's disciplinary coverage as of June, 2012, as measured by the percentage of the total data repository covered by each of JSTOR's seven human-indexed, 'macro' discipline groups. DfR covers material in the Social Sciences (29%), Humanities (26%), and Sciences (20%) in much greater depth than Business (5%) or the Arts (5%).
However, JSTOR specialists continue to develop and refine aspects of DfR, such as the number of discipline categories available.
At its most basic level, DfR may be particularly useful for historians interested in tracking the conceptualization, development, and spread of unique theories, ideas, or terminologies over time. These users are interested in simple, robust use of DfR to extract data and create graphs without having to master the esoterica of advanced bibliometric analysis-although interpreting the data may require some degree of care and ingenuity. Librarians who may find DfR helpful in assisting these individuals, or who prefer the DfR interface over the standard JSTOR search, may also utilize DfR.
DfR may also appeal to bibliometricians who require a meta-tool with the data extraction capabilities provided by JSTOR's API (Application Programming Interface). APIs--standardized interfaces that facilitate communication among software components--are offered by many systems, e.g., Facebook's API allows application developers to interface with the site to extract information such as a user's name. DfR's Representational state transfer ('RESTful') API provides a set of procedures for the user to search and extract customized content and data beyond the standard DfR platform. More information on the API is available in the DfR help documentation by placing the cursor over 'About' and selecting 'JSTOR Data for Research'; also see Snyder (2010b) and Blank, et al. (2013).
How to Use DfR
Users can access DfR at dfr.jstor.org. Before commencing a search the user sees a screen similar to Figure 2. In area (A), the user inputs keywords for the search. DfR allows both multi- and single-character truncation searching through the use of the * and "?" wildcards, respectively; see 'Search Help' under About (B). The wildcard operator can neither be used to begin a word nor to apply to a multi-word search phrase.
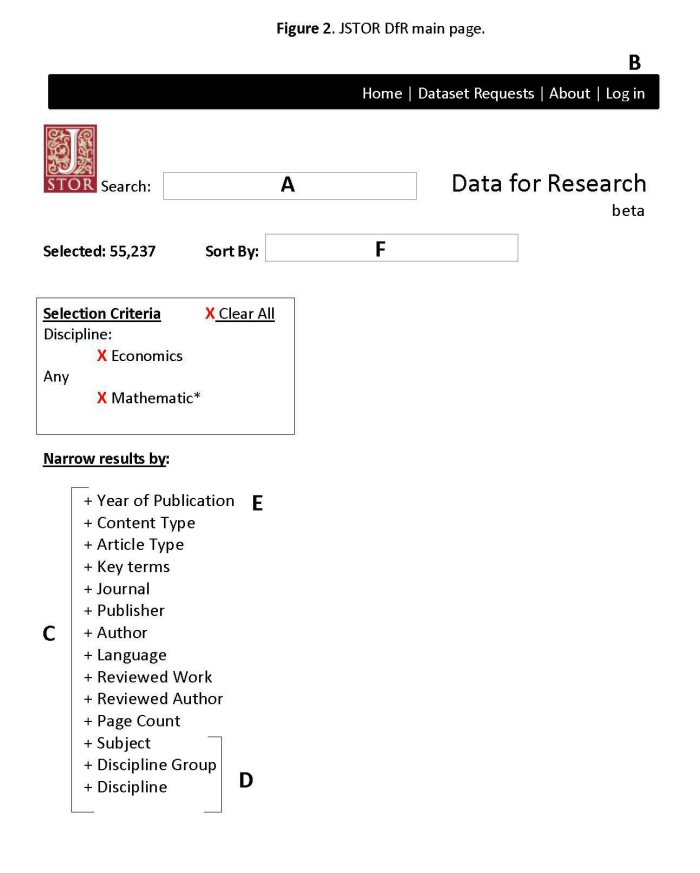
Help for searches requiring Boolean operators can also be found in section B. DfR utilizes 'AND', 'OR', 'NOT', '+', '-' operators, the first three of which must be capitalized. The '+' and '-' operators return sets that must either include or exclude the term following the operator, respectively. DfR documentation incorrectly indicates that the OR operator is the default; as it appears in use, the 'AND' operator is the implied default. To illustrate, a search of mathematical OR economics under the Economics discipline filter returns 364,137 results (as of 7/25/12). On the other hand, a search of mathematical economics returns a different set of 39,109 results identical to those obtained from a search on mathematical AND economics. This issue is further complicated when performing subsequent searches on results of previous searches. A search on mathematical followed by one (over those results) on economics is identical to 'AND', but a third (or more) search term is integrated using an OR operation. That is, a search on mathematical, then economics, then equation, returns in effect (mathematical AND economics) OR equation. Each of these terms can be truncated using wildcards. More advanced users can specify their Boolean searches using parentheses to group portions of an operation- mathematical AND (economics OR equation).
Faceted or structured searches can be performed by successively applying any of the 14 filters (Fig. 2, C) including content type, author, or publishing journal. Clicking the '+' beside a filter opens a list of options over which to screen search results. For instance, users may distinguish results according to article type, e.g., 'Research Article', 'News', 'Book Review', or 'Miscellaneous.' However, selections of successive criteria within a filter returns only the intersection of those criteria-one cannot select multiple criteria in an effort to join them with an 'OR' operator. Further, DfR lists journal titles with both ISSN and text identifiers without providing an index for identifying those designated numerically. The user is left unsure whether there is duplication between the numerical and text identifiers.
Applying the filter(s) 'discipline group,' 'subject,' or 'discipline' (D) narrows search results by topic. 'Discipline group' presents broad groups (see Figure 1), while the latter two provide a more granular distinction of the focus of an article: 'discipline' and 'discipline group' contain a menu of topics under which JSTOR-covered journals have been categorized. These two filters map specific articles included in a journal to the discipline and 'discipline group' assigned to that journal. The 'subject' filter provides a menu of subjects generated algorithmically (8/20/12 email from JSTOR). One can simultaneously view a line graph of the frequency of annual publications meeting the selected criteria by clicking the '+' next to 'Year of Publication' (E). Successive application of filters updates the graph to reflect new results, although the publication year cannot be restricted to a single year.
The drag down menu (F) enables varying degrees of temporal sorting by 'relevance' (default), 'most recent to oldest', 'oldest to most recent', and 'CiteRank', the latter of which is not explained in DfR online help documentation. Fortunately, Snyder (2010a) explains:
CiteRank is an algorithm for ranking citation networks based purely on their topology, similar to Google's well-known Pagerank. � The CiteRank values are currently used in the DfR search relevancy algorithm � [which] elevates highly cited articles in search results � [so that] selection of content by Discipline or Subject only provides listing of most influential articles for a field.
Only a subset--1.1 million, or 13%--of the more than 8 million JSTOR articles (Snyder 2010a, pp. 2, 18) are covered by CiteRank.
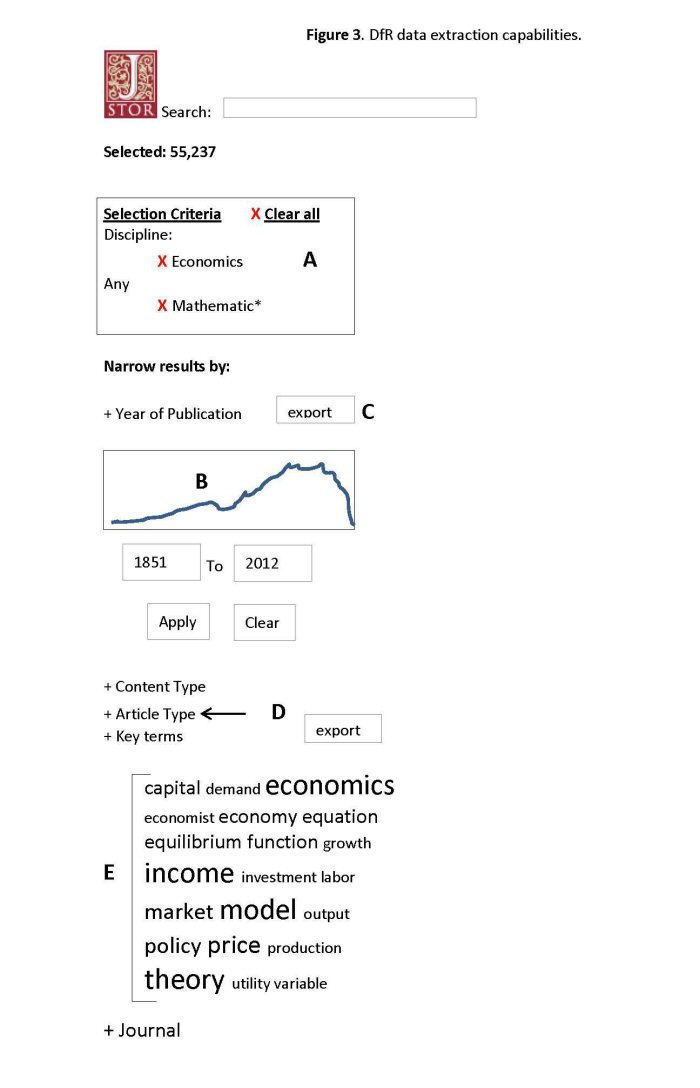
The section labeled (A) of Figure 3 identifies the selection criteria used in the search, whereas (B) illustrates the aforementioned plot of annual publications meeting the search criteria of (A). A scale allows users to manipulate the time period over which matching results are displayed. The raw data utilized to generate this graph can be exported in .json, .xml, and .csv formats by selecting 'export' (C) and the desired file extension. Application of the 'Article Type' filter (D) categorizes the user's search results by article type. The raw data for this or any other facet of a search can be extracted in an identical fashion to that just described.
From DfR one can also export a 'Key Terms' (E) spreadsheet ranking, in order of descending frequency, the most prevalent 'relevant' terms within selected full-text documents. A word cloud is provided under the tab to visualize results. This can help the user compare the frequency of terms, track shifting vocabularies within a discipline, and serve as a way to identify new terms to incorporate into subsequent DfR searches. Researchers studying linguistic regularities can use this capability of DfR. For example, based on his empirical studies, Zipf (1949, p. 25) discovered that an inverse relationship existed between the frequency of word occurrence in a text and its frequency rank; in its most basic formulation, the most relevant term occurs roughly n times more frequently than the nth-ranked term, implying limited usefulness of lower-frequency terms in DfR-generated rankings.
DfR also enables the user to retrieve "n-grams," which consist of n sequentially juxtaposed words. N-grams are used in text analysis, e.g., retrieval, comparison, editing, and recognition. For a relatively recent discussion of creative uses of n-grams in text mining, see Michel (2011). DfR lets the user obtain n-grams in three related ways. First, the frequency ranked 'Key Terms' are algorithmically weighted 1-grams: DfR sifts the 1-grams 'relevant' to a search, and presumably assigns the most relevant term a weight of one. Other terms are weighted relative to this term such that all have weight less than or equal to one. When one retrieves 'Key Terms' from the DfR interface, one receives this list of terms, absent the weights, aggregated over all publications returned by a search. Second, users can retrieve n-gram data within a document by selecting the 'More Info' link under any given publication result (see Figure 2): here, users receive ranked lists of the 15 most frequent 'top words' (n-grams with n = 1); 'bigrams', 'trigrams', and 'quadgrams' (n-grams with n = 2, 3, or 4, respectively); and weighted key terms. There is as yet no simple way to obtain, from the DfR interface, a frequency ranked list of relevant n-grams over an entire set of retrieved full-text documents-akin to 'Key Terms'-for n > 2. The addition of this ability would help users.
Finally, users can obtain a more detailed list of n-gram data utilizing the additional data extraction capabilities provided by DfR, though the user must first register for a DfR account to do so. After registering, the user returns to the standard search interface and selects the relevant search criteria. Then, placing the cursor over 'Dataset Requests' in the upper right corner and scrolling to 'Submit New Requests' (in Figure 2) brings the user to a screen to specify the request and type of data to be extracted. By default, data from at most 1,000 citations meeting the user's selection criteria will be displayed. To retrieve data on up to 10,000 articles per search, the user must contact JSTOR. Here the user can elect to retrieve separate frequency-ranked lists of all n-grams for n >= 4 or the previously discussed 'key terms' returned within each result from a specified search. After selecting the desired data format-.csv or .xls-the user can elect to receive an optional email notification that the request has been processed, or periodically view the status of their request by placing the cursor over 'Dataset Requests' and selecting to 'List Prior Requests.' Email notification will contain a link to the search results, which eventually becomes inactive. The user cannot place multiple requests at one time, but can submit additional requests as prior ones are being processed by JSTOR. All prior and pending requests and results can be accessed under 'List Prior Requests.'
An n-gram data request produces a spreadsheet of citations satisfying the user's criteria. As noted, DfR returns a unique spreadsheet, for each citation in the search results, containing a frequency-ranked list of n-grams or key terms that occur in the full text of that citation. For example, if one selected solely 'bigrams' for some criteria resulting, e.g., in 645 citations, the user would receive 646 spreadsheets-1 listing the 645 articles, and 645 unique to each citation providing the list of bigrams. To reiterate, unlike 'Key Term' retrieval in the standard DfR interface, ranked n-gram spreadsheets obtained using a 'Dataset Request' are unique to each document returned. As noted, each spreadsheet contains every n-gram in that document; a search on bigrams could result in nearly 10,000 entries per document, so our sample of 645 citations would result in 6.45 million bigrams. There is no simple way to aggregate these distinct frequency-ranked n-gram lists to generate a 'master' file of n-grams of unique and non-overlapping terms. Whether an API could be used to generate such a master list, as well as specify the location from which to extract ranked n-grams (e.g., for the title of an article or its use in references) would be useful information. Despite the depth and breadth of extractable data, the applicability of n-gram functionality appears to be rather limited. The development of methods to parse data more effectively would confer increased usefulness on DfR.
Comparison of features of different search engines
DfR's ability to do full-text searching is present in other publicly accessible, full-text databases, e.g., HathiTrust, CiteSeerX, Google Books, Astrophysics Data System (ADS), and arXiv. DfR readily enables, directly from the search interface, exportation of frequency-ranked faceted data (e.g., keyword, author, and journal titles) to spreadsheets, enabling data manipulation and visualizations. Export capabilities for these outputs are for the most part not available in the other databases above. Note that these outputs would not be available unless a search had already been done. DfR also has a particularly wide base of search criteria.
On the other hand, some databases improve upon DfR's inadequacy in tracking and visualizing citation relationships. While certainly useful when available, DfR search results only sporadically include a 'Cited by XX' link, and the service does not provide a readily accessible list of references made by a citation. Citation tracking is further complicated by the difficulty of interpreting how CiteRank operates. At best, any given DfR search result brings the user to a page that provides access via Google Scholar or JSTOR to related items, references, and citing articles. Hypothetically, one could see how many times an article was cited by others by selecting 'References' beside 'Search' and typing the title of the publication of interest in quotes, but this approach does not work well in practice; comparing the results under the 'Cited by XX' links with those using this methodology generally results in divergent results. While "references" retrieves results, their number does not match the results one obtains by going out to the "Cited by XX" link. Searching of cited references may be made easier by DfR included a feature similar to Web of Science's cited searching capability, which enables one to search on variations in the way articles have been cited.
We turn next to discuss alternate open-access databases that have elements similar to DfR's bibliometric graphing features or more capably address citation tracking. For instance, Google Books provides an "Ngram Viewer" at http://books.google.com/ngrams/. According to the explanatory documentation, "When one enter phrases into Viewer, it displays a graph showing how those phrases have occurred in a corpus of books (e.g., "British English," "English Fiction," "French") over the selected years." However, citation tracking is nonexistent.
The latest version of ADS (Astrophysical Data System) allows bibliographic and full-text searches of the astrophysics and astronomy literature. Full-text searching is available from {https://ui.adsabs.harvard.edu/}. Searching on a term brings up results with that word/phrase surrounded by portions of the full text in which they appear. According to this web page,
� "(W)hile not all of ADS's bibliographic records are currently covered by this service, it does cover the major astronomy journals, as well as physics journals published by Springer, Elsevier, the American Physical Society, and the American Geophysical Union, as well as all of the arXiv eprints."
One can also visualize data from citations and abstracts, but not full text, with the exception of the full text of arXiv articles, as discussed below. To create these visualizations, click on "Get Started" at http://labs.adsabs.harvard.edu/wiki/doku.php. Searching generates a results screen with an upper right menu labeled "More." From this pull-down, select from visualization tools, including a network of document citing/cited relationships and a word cloud. On the results page, as in DfR, there is a graph of frequency of documents versus publication date. Also, this menu provides descriptive statistics, numerical and graphical, downloadable into Excel.
The producers of ADS understand the value of text-mining: "The [ADS] project is planning to develop an API that can be used by collaborators to perform text-mining activities which will facilitate the creation and maintenance of bibliographic databases" (Accomazzi, et al. 2012). These text-mining features will range over the full text of the literature available at {https://ui.adsabs.harvard.edu/}. For a data mining project involving ADS see Allan (2012), including a comment about the role for text mining in "hypothesis generation."
arXiv, an open-access database of 800,000 electronic articles in quantitative sciences, allows users to perform searches using 12 distinct criteria, although at most three may be applied. arXiv also offers experimental full-text searching, but as their interface indicates, it is "an experimental service which may be less up-to-date than the normal search." Unlike DfR's interface it is not seamlessly integrated with the site's other search capabilities. While it provides abstracts and PDF files, there is little citation information, making it difficult to track citing trends. On the other hand, arXiv's recently-introduced 'Bookworm' platform graphs relative frequencies of topics over time. Currently, Bookworm is not completely integrated with the original arXiv platform and only allows searches over category, subject class, email domain, and author institution. One can, however, click a given plot of frequency data to view articles for a particular month-a nuance not available in DfR.
While arXiv does not itself provide the same visualization capabilities as ADS, there is an indirect way-using ADS-to visualize data not only from the full text of, but also the bibliographic and abstract data for articles in arXiv. From the 'classic' ADS screen -- to be superseded next year by search capabilities available from http://labs.adsabs.harvard.edu/wiki/doku.php according to C. Erdmann at Harvard -- select (near the top) 'arXiv e-prints,' run a desired search, mark citations from the list, and select "Export selected articles to ADSLabs" near the bottom of the results. This connects with ADS to exploit its advanced features.
HathiTrust is another major initiative to preserve and provide access to the full text of books scanned from library collections and other sources. The HathiTrust interface enables searching of OCR-ed full text. The full text of close to a third of the total 10.4 million volumes is publicly viewable. While HathiTrust enables visualizations of aggregate statistics relating to call number, language, and date, and provides the ability to narrow search results by facets, it does not currently provide a search interface that enables the type of data mining that DfR provides--such as the ability to plot result frequency over time or generate n-gram data. The HathiTrust search engine does not provide the ability to identify citing articles. However, HathiTrust notes that their data mining services are under development (http://www.hathitrust.org/objectives; http://www.hathitrust.org/datasets). In addition, a representative of the HathiTrust mentioned "plans to create a Research Center equipped with a variety of tools and services to allow a broad variety of analyses on the repository corpus."
In CiteSeerX, developed in 1997 as one of the first automated citation indexing systems, users can perform full-text searches over computer and information science literature. CiteSeerX allows searching and sorting results in a manner similar to DfR, although it does not support truncation wildcards. Advanced search over a range of publication years is available, as is the ability to exclude results containing fewer than a specified number of citations. Selecting a search result brings the user to a brief summary page listing references made by the article (and the number of times those articles were cited) as well as a list and line graph of the number of articles citing a given result over the selected period. Conveniently, registered users can save a search and add it to a "collection" -- not possible in DfR.
While CiteSeerX's citation tracking and ADS's visualization of citation networks are superior to those offered by DfR, the latter has a great advantage in its ability to generate ranked frequencies, e.g., of terms, titles, and authors to export them to a spread sheet for further statistical and graphical analyses. The breadth of material covered by DfR dwarfs that of the databases discussed here, and the integration of more enhanced capabilities to address its comparatively weak areas would serve to further elevate DfR 's status as a full-text searching service.
DfR versus the Standard JSTOR Interface
We next briefly compare DfR's capabilities, advantages and limitations to those of the standard JSTOR interface. Both allow users to search over identical disciplinary areas, but DfR provides the additional ability to search over broad disciplinary areas and algorithmically assigned subjects. Nonetheless, there remains a great deal of overlap in the remaining areas over which a user can narrow a search, including via publication type, time period, or language using the advanced search. Users are also able to access the full text of publications in each engine if one's institution has a subscription to the JSTOR collection. For the general public needing access to JSTOR articles, see {http://about.jstor.org/get-jstor/}.
DfR provides, from the left side of the search interface, key term rank and the ability to view graphs of raw data for the number of papers meeting search criteria versus publication year and for page counts. DfR weights search results differently from standard JSTOR, because of JSTOR's use of DfR as a test platform to experiment with possible improvement, the intention of which is to provide better search results over the standard interface. The standard search engine does not allow creation of charts, although one can download search results from the standard search engine to Excel to do so. The DfR search index also differs from that on the standard JSTOR interface: this is evident when comparing the journals covered in JSTOR to those in DfR. The latter list is much longer. A JSTOR representative indicated that JSTOR plans to incorporate some of DfR's features and functionality in a future version of the standard search interface.
Example of a Simple Bibliometric Study Using DfR: Applications of Mathematics in Economics
We now turn to examples of DfR that may benefit practitioners who need a simple yet robust tool to study the evolution of their disciplines. DfR can track trends in the tools deployed within a discipline--for instance, the introduction of mathematical techniques in economics, which we shall refer to as the 'mathematization' of economics. We will provide via DfR an historical overview of mathematical applications in economics. In doing so, we highlight several issues the user may confront while interpreting DfR search output. In addition, we examine the coincident rise of mathematical applications in biology and psychology.
The Origin and Evolution of Mathematics in Economics
Historians of economics generally agree that economics became heavily mathematized after World War II, especially due to the doctoral dissertation and subsequent research of economist Paul Samuelson, who identified, synthesized, and promoted this approach (Samuelson 1947; Samuelson 1979; Glaeser 2009). However, the mathematization process actually began earlier, e.g., via two different types of mathematical statistics with separate purposes: descriptive versus inferential. Determining, however, a specific date for the advent of mathematics in "political economy," the predecessor of today's "economics" discipline, offers challenges and depends on the level and type of mathematical analysis chosen.
For instance, bookkeeping and accounting systems, requiring only simple arithmetic for commerce or computing available resources have been in evidence for millennia (Studenski 1958). "Pure" mathematics is the symbolic, analytical "language"--symbols, operators, variables, algebra, and differential and integral calculus--of math used to describe, define, and analyze economic events, behaviors, and outcomes. This was the basis for the economics subfield that began to emerge in late 19th and early 20th centuries as "mathematical economics." In order to lay claim to a strong foundation for description and deduction, economists used mathematical symbols, logic, and rigor to imbue economics with expository abilities similar to the physical sciences.
Schabas (1992) describes the interactions and debates between the Britons Jevons and Marshall in the last quarter of the 19th century as they argued how to present--graphically and algebraically--basic economic principles of market-based supply and demand used to compute analytical solutions, e.g., for the economy's equilibrium. In the 1930s, R.G.D. Allen of the London School of Economics (UK) furthered the use mathematics in economics when he published nearly a decade of his class lectures in Mathematical Economics (1938); by 1966, the second edition had become Mathematical Analysis for Economists. He organized his tome by mathematical topics and how each related to economic concepts, and suggested that the general adoption of mathematics to explicate economic analyses began at the turn of the 20th century. As an indicator of the maturity of this subfield, there were a number of similar texts by the mid-1960s, e.g., Chiang (1967). Debreu (1989) gives an excellent description of the main features of the mathematization of economics from the 1930s to late 1980s.
Mathematics also found its way into economics via an increasing emphasis on statistical methods, substantially based on probability and inferential concepts. This field, which became econometrics, included extensive use of empirical, observational data that were measured or counted for estimation and hypothesis testing. While empirical data had been used for centuries for descriptive purposes (e.g., in record-keeping systems for commerce), practical inferential analyses of data could not be expanded until the development of estimation methods, such as Gauss's late 19th century applications of regression and correlation. Extensive empirical data manipulations with mathematical operators had to await the invention of computing technology that began to develop rapidly and urgently for wartime weapons systems during WWII and the Korean War. This process culminated in the early 1950s as the first practical digital computer became available to analyze statistical data in estimating partial regression coefficients and diagnostic measures for testing the significance of a single equation or small simultaneous equation systems. Morgan (1990) authored one of the first accounts of the history of modern econometrics, attributing its origin to Haavelmo's 1943 and 1944 papers on hypothesis testing and simultaneous equation methods of identification, estimation, and evaluation. Whether the concepts and processes of econometrics can be tied directly to ancient history is an interesting question. It is clear that identifying a specific origin of mathematics in economics is still an open question.
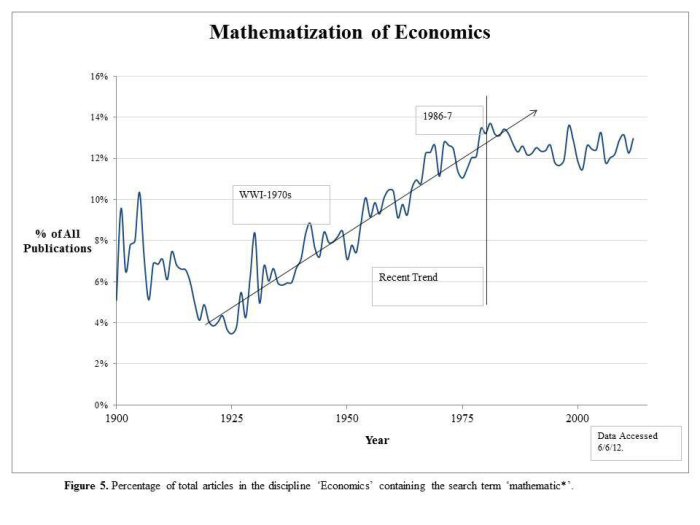
To address this scholarly disagreement quantitatively, one can use DfR to extract and graph the total annual economics literature from, e.g., 1900 to present, then superimpose the number of annual publications resulting from a search on mathematic* within the discipline of economics. The two superimposed trend lines are shown in Figure 4. Figure 5 provides an alternate, clearer comparison of the broad trend by displaying the ratio of the latter to the former dataset, that is, the annual proportion of all economics articles resulting from a search for mathematic*.
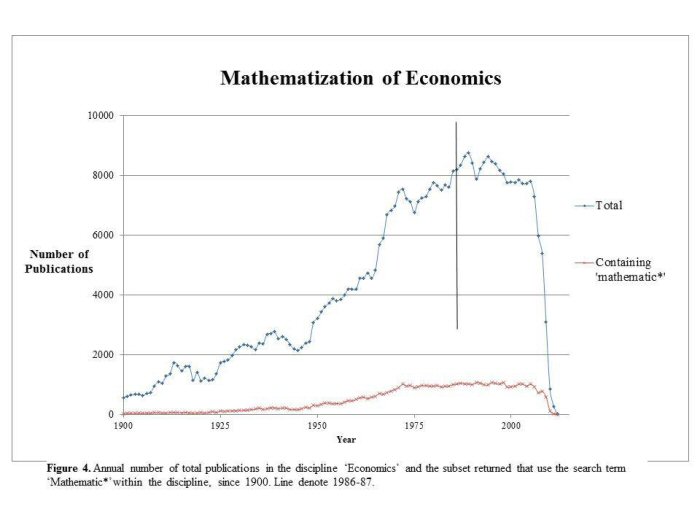
The data in Figure 4 support the idea of a 'boom' in both general and mathematical economics beginning in 1950s. However, Figure 5 illustrates that mathematics had increasingly become a larger proportion of economics literature in the post-WWI era. From approximately 1920 to 1985, the share of 'mathematized' economics rises with a long-term linear trend from about 4% to nearly 14% per year, or roughly 1.6% per decade. Considering that there was a rapid rise in total publication volume, the continued increase in the share of articles concerning mathematical economics indicates that the latter was increasing at a greater rate than economics publications generally. Henceforth, the proportion of such publications has remained at approximately 14%. Despite the ease with which our conclusions were generated, however, researchers using DfR nevertheless face interpretive challenges to identify reasons behind specific results. There are four effects that might introduce bias into our analyses, but we found no reason that these effects would change our overall conclusions in this particular example.
Interpretive Challenges in the Use of DfR
1. The "Absorption" Effect. In Figure 5, one obvious question is why the trend percentage of articles is roughly flat starting about 1986-7 through the present, that is, 0% growth during these years. An explanation for this result is that use of mathematic* leveled off in the development of the literature and it was no longer explicitly necessary to invoke it. For example, the term "mathematical" declined because such techniques had become so widespread that use of the general qualifier "mathematical" (as in, e.g., "this is a mathematical study," or, "in this paper we employ mathematical models") was implicitly understood. Yet however this absorption effect impacted the data, there is strong evidence that references to mathematics grew greatly in the postwar period.
2. The "Rolling Wall" Effect. A pattern we have seen over and over again regardless of the search is also evident in Figure 4, where we see that growth rates drop off precipitously from about 2004 to the present. One reason could be the "Absorption" Effect above. Another reason could be that journals in JSTOR have a "rolling wall" of coverage. For example, JSTOR coverage of any particular journal may not extend to the present due to the strategic decision of the journal manager to restrict immediate access to those users with paid subscriptions. As of July 1, 2012, JSTOR does not cover the American Economic Review beyond 2009.
One can still compare the most recent number of occurrences of a search term versus publication year, although the statistical reliability of the raw data likely declines with the decreased number of results. This could be due to the artificially induced statistical bias from the "rolling wall" effect. One possible way to study this bias would be to examine the individual rolling walls for all the journals covered within the search results for the last several years, and then assess how much of the drop-off results from the effects of e.g., institutional factors such as restricting use only to subscribers. A quantitative estimate of this moving wall effect from all journals included in the search could be created by averaging the lag time for each journal between its cut-off date and the present. The mean time could be weighted by, e.g., the proportion of articles in each journal and depending on the importance of having a quantifiable estimate within a specific confidence interval one could focus on a desired subset of journals. Further analysis in this direction, however, is beyond the focus and scope of this paper.
Figures 4 and 5 raise other interesting complications about the duration of the rolling wall effect. First, the period during which the percentage of publications in Figure 5 begins to flatten out is somewhat uncertain, as the number of both total and mathematic* articles begin to decline (Figure 4). This limited sample size raises reduces the statistical validity of any interpretations generated using data from this phase, and necessarily leads to wider confidence intervals about the 'recent' trend line in Figure 5. It also raises the possibility of a return to the 'long-run' historical trend, as the effect of the rolling wall may artificially distort publication numbers such that an investigation 5 years hence would reveal continuation of the long-run trend-or even a new downward one.
We will not attempt to quantify this effect, but a step towards doing so would be to calculate how the confidence intervals expand as a result of the rolling wall effect. At this point, our best hypothesis is that the individual trends in Figure 4 will not drop so precipitously unless there has been a major, underlying structural shift in the production process of scholarly articles. Unfortunately, however, this may only be identified and validated in five or more years.
3. The "Afterglow" Effect. In addition to the use of specific key words in the title or author's text of an article, we have discovered that the scholars' requirement for referencing relevant antecedent materials can lead to additions to the frequency of the key words contained in the original work. Burns, et al., briefly describe an example about spelling the word "chymistry:"
Searching for the word "chymistry," gives a line graph that demonstrates how usage of the word fading [sic] as time increases, until suddenly at the turn of this century there is a spike in usage. Analysis shows the occurrence of this word is in citations - modern scholars are using digitized works on the Internet in their research. (Burns, et al., 2009, 419).
In other words, an unexpected upsurge in the word "chymistry" may result from recent/later publications citing literature from the past that employed this spelling of "chemistry." We do acknowledge that these results may have more mundane mechanical causes, e.g., a misspelling in the Optical Character Reader (OCR) translation or other transcription error. However, this suggests another possible source of bias in the citation data, which we call "afterglow." Relating this effect to the search of mathematics usage in economics publications, new invocations of mathematic* actually may have begun to drop off while frequencies were artificially--but predictably--inflated due to references to earlier publications concerning mathematics.
It is not clear, however, that the afterglow effect negates or weakens our overall conclusions. Even if uses of the term mathematic* were artificially inflated due to citing previous works using this term, the citing papers had, to some extent, a basis focused on mathematics. Either the titles of the papers contained mathematic*, or the title of the journal in those papers contained the term mathematic*, or both. A cited paper that contains a term mathematic* would quite likely not have been cited unless the citing paper also dealt with use of mathematics. One would hope use DfR to minimize this effect by restricting searches to the body of the text of citations--excluding foot- or endnotes and the references--but DfR does not currently offer this capability. Alternately, the researcher could use ISI-cited half-life data for the economic literature covered in Web of Science for recent years and make assumptions about the extent of citations of earlier literature to scale search results.
4. The False Drops Effect. Whereas the three aforementioned effects may exist over specific sub-periods covered by the search and are the result of the search methodology itself, another is based on the word meaning and context of homographs that may lead to search results that satisfy the search key words entered but are irrelevant to the researcher's interest (e.g., 'bow of a ship' and 'bow at the waist'). For our present context, which concerns use of mathematics in economics, a search might return a biographical account of an economist who mentioned that his/ her cousin was a mathematician. A researcher should vigilantly monitor this effect when using DfR to study a term whose spelling has completely different meanings in various contexts. Fortunately, the number of such cases is probably limited for the application of mathematics in economics, as no such examples immediately spring to mind.
In Figure 5 we assume that the proportion--rather than an absolute number--of false drops in any given year remains constant year over year. To counteract the "false drops" effect, one can try one or more of the following: handpick relevant hits, rejecting the false drops; use more, or narrower, filters and facets to further limit the results; or search on terms that do not have homographs. The challenge of creating a programming routine that can distinguish false from "true" drops is very daunting. As it currently stands, the user has to "post-process" the search results to exclude false drops.
Use of Specific Mathematical Concepts in Economics
Our approach has thus far been characterized by a broad, simplistic view of the application of mathematics in economics. However, DfR allows for a much more granular and informative bibliometric analysis of the topic at hand. Figure 6 illustrates the prevalence of ten different concepts closely associated with the mathematization of economics, as measured by the annual number of publications within economics satisfying each search term (where each contains a * wildcard to capture different variations of the term) for the period 1940-2012. Figure 7, on the other hand, depicts the percentage of all articles within economics satisfying each search criterion on an annual basis for the same time period.
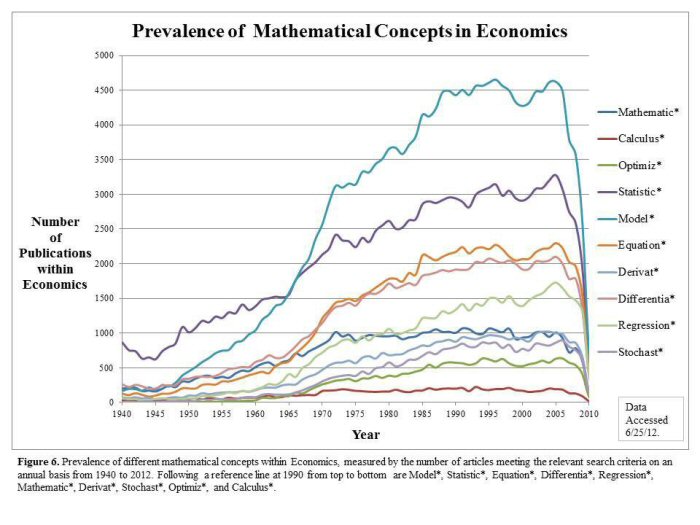
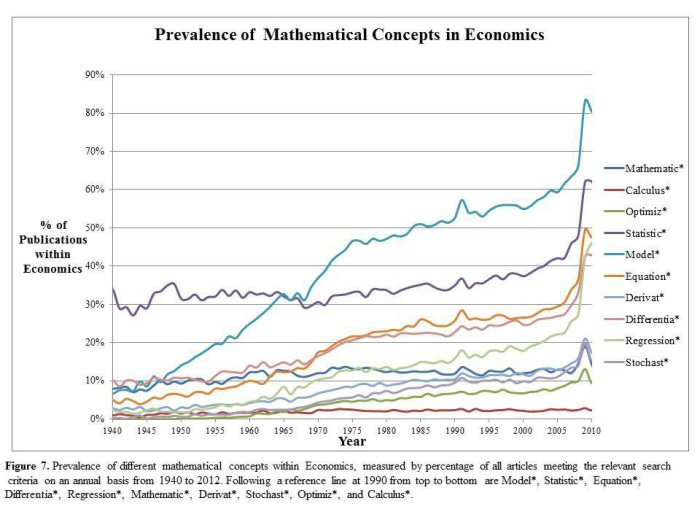
There is certainly bound to be some overlap among the topics. Statistically, pairwise correlation coefficients among these concepts are typically of magnitude > .8 regardless of the time period over which they are calculated. Nonetheless, Figure 6 depicts a large explosion in the absolute number of articles pertaining to topics in mathematics, particularly in the mid to late 1960s. Figure 7, on the other hand, illustrates that many topics maintained or expanded their share of all economic content; search results for model*, equation*, and differentia* attained a particularly large and increasing fraction of the literature, lending credence to the general rise of mathematics and the use of calculus within the field.
Tracking a Specific Concept in Economics
DfR's extensive coverage makes it possible to analyze not only broad trends in disciplines but also specific methodologies, concepts, and theories in order to identify the birth, 'heyday', and rejection of a theory, concept, or technique (cf. Michel 2011). As an example, we chose 'turnpike theory,' a set of ideas designating the optimal path of capital accumulation to foster macroeconomic growth. Their origin is generally credited to Dorfman, Samuelson, and Solow (1958).
Figure 8 presents three sets of data representing the percent of annual economics publications from 1961-2012 from searches on:
- "turnpike theorem"
- "turnpike theorem" AND mathematic*
- "turnpike theorem" within those articles returned under mathematic*
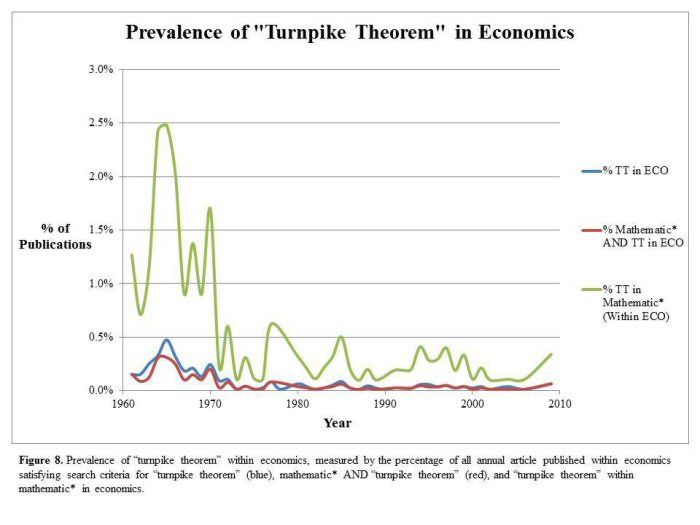
The former two searches do indeed show a small burst in publications volume, particularly in the mid-1960s. This may reflect a brief gestation period between the introduction of the theory and subsequent papers investigating its implications. Clearly, though, publications on the topic have been sporadic since at least the 1990s, if not earlier. The particularly interesting result is that articles concerning the turnpike theory accounted for nearly 1.5% to 2.5% of articles concerning mathematics within economics throughout the 1960s.
Considering the breadth of ideas within the sub-discipline, this is certainly strong evidence of the prevalence of the theory at the time, although Figure 8 also shows that the term fell out of prominence in the 1970s and thereafter. Thus, DfR has allowed us to track both broad-based and unique, singular trends within the field. Though a cursory evaluation of DfR's capabilities, these brief examples above have provided an insight to the variety of applications for DfR.
Uses of Mathematics in Other Disciplines
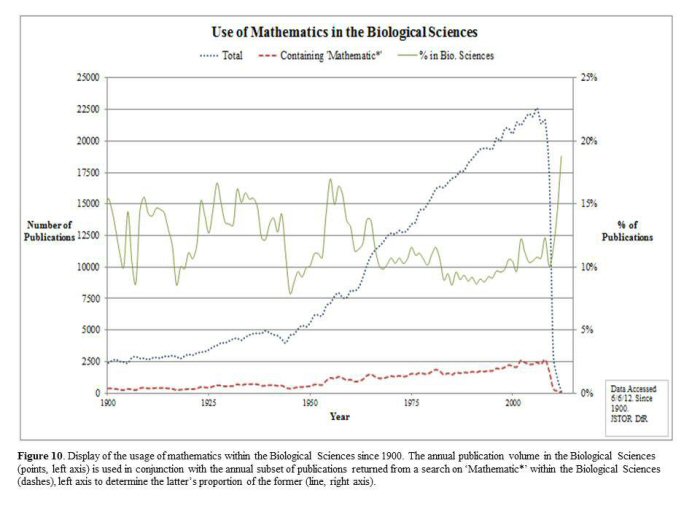
Historians of different disciplines will find DfR useful as well. In addition to mathematics within economics, we also tracked the rise of its use in both psychology (Figure 9) and the biological sciences (Figure 10).
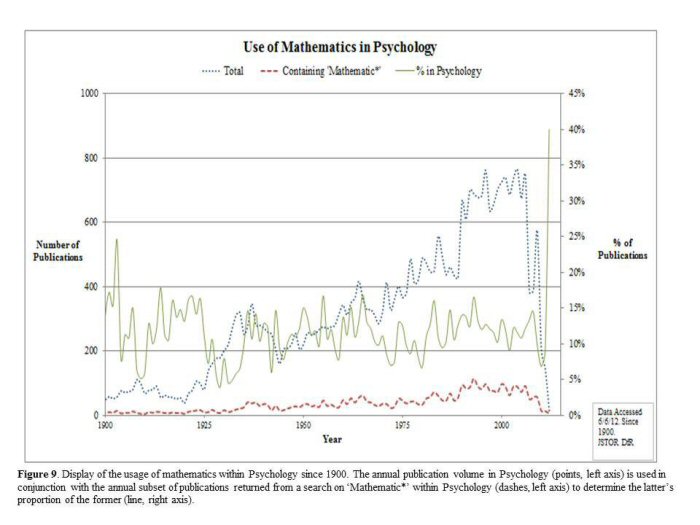
Unsurprisingly, the advent of computational technologies and hardware provided opportunities to perform calculations previously too difficult to accomplish quickly. The charts display a pattern similar to that of Figure 5, exhibiting a sharp increase in the rate of publication of both total and mathematical works within each discipline.
Conclusion
JSTOR's Data for Research presents a valuable tool for a variety of library professionals, bibliometricians, and researchers. Covering 57 disciplines and almost 8 million articles, it allows users to track the prevalence of key terms, techniques, and theories over time. Additional data extraction capabilities provide the ability to obtain n-grams and citations matching selected search criteria, publication volume, and even the stature of a given journal over time. Further, users familiar with RESTful web APIs may use them for programing, searching and data extraction. As DfR is developed, the introduction of further functionality, such as visualizations of search results and a streamlined ranking of n-grams for large sets of articles will serve to enhance its suitability as a bibliometric platform for researchers with varying skills and goals.
Our analysis reveals several potential issues that may arise during data extraction and interpretation with DfR. By failing to account for possible bias, e.g., the rolling wall effect, a researcher may draw misleading conclusions from the data. Conceptual development and testing of indicators for the four effects we mentioned would be useful. Similarly, we have highlighted several shortcomings within the DfR platform which, if addressed, would further simplify the search process while simultaneously expanding the capabilities of the service. Also, we have mentioned strengths of competing databases. Even so, DfR is a valuable bibliometric tool. We will be interested to see how JSTOR incorporates features of DfR into its standard search engine. On balance, DfR serves as a model for how databases with massive digitized content can be developed for full text bibliometric analyses.
References
Access for Individuals. [Internet]. [Cited 2012 Aug 27]. JSTOR. Available from: {http://about.jstor.org/get-jstor/}
Accomazzi, A. et al. 2012, Telescope Bibliographies: an Essential Component of Archival Data Management and Operations [Internet]. Cambridge [MA, USA]: Smithsonian Astrophysical Observatory. Available from: http://arXiv.org/abs/1206.6352v1. Also available in print as Proceedings of Society of Photo-Optical Instrumentation Engineers (SPIE), Conference Series. Vol. 8448.
ADS Labs Fulltext Search. [Internet]. The Smithsonian/NASA Astrophysics Data System. [Cited 27 Aug 2012] Available from: {https://ui.adsabs.harvard.edu/}
Allan, A. Mining the astronomical literature: A clever data project shows the promise of open and freely accessible academic literature. O'Reilly radar: insight, analysis, and research about emerging technologies. Radar: News & Commentary [Internet]. [Cited 8/16/2012] Available from: http://radar.oreilly.com/2012/08/data-mining-the-literature.html
arXiv.org Search. [Internet]. [Cited 27 Aug 2012]. Available from: http://arxiv.org/find
Association of Research Libraries. [Cited 2012 January]. Code of Best Practices in Fair Use for Academic and Research Libraries [Internet]. Available from: http://www.arl.org/pp/ppcopyright/codefairuse/code/index.shtml
Bookworm. [Internet]. [Cited 2012 Aug 27]. Available from: http://arXiv.culturomics.org/
Burns, J., et al. 2009. JSTOR-Data for Research. In: Agosti, M. and Borbinha, Jose, editors. Research and Advanced Technology for Digital Libraries. Berlin: Springer. p. 416-419.
Blanke, T. et al. 2012, Linked Data for Humanities Research -- The SPQR experiment. 6th IEEE International Conference on Digital Ecosystems Technologies (DEST), 6/18/ 2012. p. 1-6.
Chiang, A.C. 1967, 1984. Fundamental Methods of Mathematical Economics. New York: McGraw-Hill.
Data for Research (DfR). JSTOR [Internet]. [Cited 27 Aug. 2012]. Available from: http://dfr.jstor.org/
Debreu, G. 1991. The mathematization of economic theory. American Economic Review 81(1): 1-7.
Dorfman R., et al. 1958. Linear Programming and Economics Analysis. New York: McGraw-Hill.
Glaeser, E. 2009. Remembering Samuelson, who forever fused economics with math. New York Times [Internet]. [Cited 2012 September 14]. Available from: http://economix.blogs.nytimes.com/2009/12/14/remembering-samuelson-who-fused-economics-with-math/
Google Ngram Viewer [Internet]. [Cited 2012 Aug 27]. Available from: http://books.google.com/ngrams/info
Haavelmo, T. 1943. The statistical implications of a system of simultaneous equations. Econometrica 11(1): 1-12.
Haavelmo, T. 1944. The probability approach in econometrics. Econometrica 12(1).
HathiTrust Digital Library | Datasets. [Internet]. [Cited 2012 Aug 27]. Available from: http://www.hathitrust.org/datasets
HathiTrust Digital Library | Functional Objectives. [Internet]. [Cited 2012 Aug 27]. Available from: http://www.hathitrust.org/objectives
HathiTrust Digital Library | Our Research Center. [Internet]. [Cited 2012 Aug 27]. Available from: http://www.hathitrust.org/htrc
HathiTrust Digital Library | Statistics Information. [Internet]. [Cited 2012 Aug 27]. Available from: http://www.hathitrust.org/statistics_info
Hobbs, J. 1986. Homophones and Homographs: An American Dictionary. Jefferson (NC): McFarland & Company, Inc., Publishers.
Michel, J-B., et al. 2011. Quantitative analysis of culture using millions of digitized books. Science 331(176): 176-182.
Mitchell, E. 2012 Leveraging metadata to create better web services. Journal of Web Librarianship 6(2), 136-139.
Morgan, M. 1992. Haavelmo and the birth of modern econometrics: A review of the history of econometric ideas (Cambridge University Press, UK. 1990). Reviewed by J. Heckman, Journal of Economic Literature 30(2): 876-886.
Samuelson, P.A. 1947. Foundations of Economic Analysis. Boston (MA): Harvard University Press. Also 1979, New York: Simon and Schuster/Atheneum.
SAO/NASA ADS Custom Query Form Mon Aug 27 10:43:11 2012. [Internet]. [Cited 27 Aug 2012]. Available from: http://adsabs.harvard.edu/abstract_service.html
SAO/NASA Astrophysics Data System ADS Labs. [Internet]. [Cited 27 Aug 2012]. Available from: http://labs.adsabs.harvard.edu/wiki/doku.php
Schabas, M. 1989. Alfred Marshall, W. Stanley Jevons, and the mathematization of economics. Reviewed work(s), Isis 80 (1): 60-73.
Snyder, R. 2010a. JSTOR: Data for Research Service [Internet]. [Cited 27 June 2012]. Available from: {http://www.catholicresearch.net/info/FebForum/JSTOR_dfr_nd.ppt}
Snyder, R. 2010b. JSTOR: Data for Research API [Internet]. [Cited 5 July 2012]. Available from: {http://www.catholicresearch.net/info/FebForum/JSTOR_dfr_api_nd.ppt}
Studenski, P. 1958. The Income of Nations: Theory, Measurement and Analysis: Past and Present. New York: New York University Press.
Zipf, G. 1949. Human Behavior and the Principle of Least Effort: An Introduction to Human Ecology. Cambridge (MA): Addison-Wesley. p. 25.
Acknowledgements
We benefitted from several individuals' comments about this paper: Prof. Brian Davison (Department of Computer Science and Engineering, Lehigh University) made suggestions to improve an early draft; a representative from JSTOR Data for Research service provided insight about DfR functionality; Chris Erdmann, Head Librarian (Harvard-Smithsonian Center for Astrophysics, John G. Wolbach Library) commented on the ADS and its future development; Jeremy York furnished information on the HathiTrust database. Also, critique from anonymous reviewers improved the final version. Remaining errors are the authors' responsibility.
| Previous | Contents | Next |
