| URLs in this document have been updated. Links enclosed in {curly brackets} have been changed. If a replacement link was located, the new URL was added and the link is active; if a new site could not be identified, the broken link was removed. |
![]()
The 2003 STS Continuing Education Survey: Selected Analyses of Science Librarians' Interests
Auburn University Libraries
chrismc@auburn.edu
Abstract
According to the 2003 ACRL Science and Technology Section (STS) Continuing Education Survey, improving liaison relations with academic faculty, information literacy in the sciences, and the effect of electronic sources on library collections and services greatly interested science librarians. Close behind were subject reference sources and presentation and teaching skills. Alternative scholarly communication leaped to the top of the list of respondent-generated topics. Little interest was demonstrated in traditional management skills. Both regular ALA attendees and non-regular attendees ranked continuing education needs in the same way; thus, changing convention session content may not increase attendance. Similarities and differences between the two groups in preferred delivery methods were found.
Introduction
What do science librarians want to learn? So that the Association of College and Research Libraries (ACRL) and its Science and Technology Section are able to provide high-interest programs and services, the STS Continuing Education Committee designs and conducts a biennial survey of its members. In the published analysis of the 2001 survey, Desai (2002) traced its history and reviewed the relevant literature. Growing from print and fax surveys to e-mail, the current method is to use the STS-L listserv/mailing list as the main vehicle for promotion of and direction to the web-form survey. This paper assesses the content and delivery-method preferences expressed by the 2003 survey takers, with special attention to comparing regular ALA attendees with non-regular attendees.
Method
Designed by The Committee, a survey form sought Likert-like-scale interest level responses to predetermined options. Data wells were then supplied so that three topics of greatest interest could be recorded. Demographic and membership questions followed. Respondents indicated which types of instruction delivery they preferred. Then came questions about the STS Sci/Tech Library Mentors program. A final question asked who would attend Special Libraries Association (SLA) preconferences if they could attend at SLA member rates. Appendix 1 is a copy of the survey. Preliminary results were provided at the 2004 ALA Midwinter Meeting. The complete report, here Appendix 2, was made available through a link on the {Continuing Education web page}.
Who Took the Survey?
Ninety-one individuals completed the survey. This was significantly fewer than the 144 who filled out the 2001 survey. STS-L, the listserv which publicized the survey, reaches about 1,100 subscribers at any given time, not all of whom belong to STS. The Fall 2003 personal membership count for STS itself was 1,390. The small number of respondents relative to the potential population should be kept in mind when interpreting the results. No type of membership was required in order to take the survey. Thus, while 95% of the respondents belonged to the STS-L listserv, only 85% were members of STS. The Committee felt the advantages of a more broadly cast information net outweighed any loss of focus on membership needs. Fifty-seven percent regularly attended ALA meetings, down slightly from 60% in the 2001 survey.The survey report (Appendix 2) describes the sample in greater detail. Some characteristics of the respondents were:
- Fifty-four percent had undergraduate degrees in science and technology.
- Forty-one graduate degrees in addition to the MLS were reported.
- Beginning and advanced career stages predominated over mid-career.
- Females accounted for 80%, males 18%, with 2% not indicating gender.
Interest Ratings
Respondents were presented with twenty-two topics to rate on a Likert-like scale. A legend "not interested-->somewhat interested-->very interested" above radio buttons indicated how the choices should be marked. These were analyzed on a zero-(no interest)-to-four (high interest) scale. Figure 1 shows the results, sorted from most points received to least.
![[Likert-Scale Responses to Interest Categories]](refereed-1.jpg)
The box-and-whiskers plots, commonly called box plots, on the right of Figure 1 show the importance of each category to the respondents. The left and right boundary of the box represents the twenty-fifth and the seventy-fifth percentiles respectively. Half of all cases are within the box. Thus, the high-scoring "Improving liaison relations..." has a small box of scores tightly concentrated at the higher end of the range, at three to four points. The mid-range "designing web tutorials" scores were more broadly distributed, resulting in a longer box. "Whiskers," or lines, extend to the edge of the expected values. Outliers, those cases 1.5 to three box lengths from the edge of the box, are represented by the colored O's. One extreme value can be found in Figure 1. It is still farther away from its box than the outliers, and is marked by an asterisk (*). The thick black lines within the boxes represent the median, or middle, score of each category.
The top three choices in Figure 1 tell the story of science librarians eager to work with their patrons to survive in the current costly and fluid environment. Improving liaison relations with academic faculty earned the highest average score. (In the 2001 survey, a similar item, "Effective liaison meetings," ranked seventh). Faced with making unhappy choices regarding expensive journal subscriptions, electronic versus print formats, and scant monograph funds, perhaps librarians desire to bring faculty members into the decision-making process. A more positive interpretation might be that librarians want to make sure teaching faculty members know about and are able to use our wealth of material.
Good relationships are important in order to develop programs for our second-ranked interest, information literacy. Information literacy, which received the most indications of high interest in the 2001 survey, is to a certain extent the student equivalent of the first interest. Even as we need to work with academic faculty, we need to work with students to make sure they too make the best choices in their crowded and confusing information world. We need the relationship with the faculty to make sure class work helps develop discrimination and introduces students to the most appropriate material.
Both these interests result in part from our third interest, dealing with the effect of electronic resources on collections and services, which was not among the highest rankings in 2001. The rest of our interests, for the most part, stem from these, and reflect specific knowledge needed to address the first three. Whether it is designing web tutorials, using citation software, or coping with the cost of serials, all are specific skills needed for making the top three challenges work well. It only makes sense, then, that the general topics received many votes, and the specific ones received votes only from those charged with specific tasks. If these suppositions were true, and we don't know that they are, the more widely expressed interest might stem at least in part from the general nature of the topic. If most conference sessions present only general topics, then are we not left with many people with general ideas and few people with the actual specific skills and knowledge to make things work? We need to make sure that specific knowledge accompanies general knowledge.
Low-Interest Items
The items with the lowest scores were budgeting basics and managing staff. This repeats the findings of the 2001 survey. Managing staff received the most zero-interest scores (18). Librarians see continuing education's main tasks as improving professional competence and patron service (Smith & Burgin 1991). These low-scoring items support basic professional duties indirectly rather than directly. This cannot be the entire reason for their lower scores, since licensing and consortial collaboration, also one step removed from direct service, scored higher. Before dismissing budgeting basics and managing staff out of hand, note that Figure 1 shows they received 170 and 157 points respectively. At least some librarians are interested. Eighty percent of the librarians responding attached some importance to budgeting basics, the topic with the highest number of zero ratings, by scoring it one or higher. In her analysis of the 2001 survey, Desai took pains to make us understand that even the lowest-scoring items held at least some interest for numerous individuals. These items only lost ground to more pressing or emergent concerns. One is tempted to suggest that with the centralization of libraries in the latter part of the twentieth century, fewer science librarians are direct supervisors of staff members and fewer have direct control of student and material budgets. As a result, younger librarians fail to see these skills as paths to advancement, and older librarians don't need them. Another investigation would be necessary to seriously pursue that line of thought.It took well into the seventeenth of twenty-two ranked items to accumulate 80% of the total scores. In other words, it took 73% of items to account for 80% of the interest. Our interests are after all not too highly concentrated.
ALA Attendees versus Non-attendees
ALA Program planners need to know if differences exist between the interests of those likely to attend its conferences and those who are not. Fifty-two respondents said they were ALA attendees, thirty-eight answered that they were not, and one provided no information. Data from this last case was excluded from the following test. Each group's scores from the Likert-like choices were isolated and ranked from highest total score to lowest. The results can be seen in Table 1.
| Table 1. Comparative Rankings of Interests, Regular ALA Attendees vs. Non-Regular ALA Attendees. | ||||||
| ALA Attendees | Non-Regular ALA Attendees | |||||
| Interests (Highest to Lowest) | Total | Rank | Interests (Highest to Lowest) | Total | Rank | |
| Improving Liaison Relations w Academic Faculty | 151 | 1 | Information Literacy in the Sciences | 131 | 1 | |
| Information Literacy in the Sciences | 148 | 2 | Improving Liaison Relations w Academic Faculty | 129 | 2 | |
| Effect of Electronic Sources on Library Collections and Services | 147 | 3 | Presentation and Teaching Skills | 118 | 3 | |
| Selecting Electronic Resources | 140 | 4 | Subject Reference Sources | 116 | 4 | |
| Subject Reference Sources | 139 | 5 | Effect of Electronic Sources on Library Collections and Services | 112 | 5 | |
| Designing Web Tutorials | 138 | 6 | Selecting Electronic Resources | 105 | 6 | |
| Design Tools for Instructional Web Sites | 136 | 7 | Providing Access to Electronic Resources | 104 | 7 | |
| Coping with the Cost of Serials | 134 | 8.5 | Coping with the Cost of Serials | 102 | 8 | |
| Providing Access to Electronic Resources | 134 | 8.5 | Design Tools for Instructional Web Sites | 89 | 9 | |
| Presentation and Teaching Skills | 133 | 10 | Professional Advancement | 87 | 10 | |
| Professional Advancement | 128 | 11 | Licensing Issues and Strategies | 85 | 11 | |
| Web Tools (Java, CGI Scripting, etc.) | 126 | 12 | Electronic Reference (e-mail, chat, etc.) | 84 | 12 | |
| Copyright Issues | 120 | 13 | Consortial Collaboration | 83 | 13 | |
| Electronic Reference (e-mail, chat, etc.) | 118 | 14 | Improving Document Delivery Services | 82 | 14 | |
| Consortial Collaboration | 117 | 15 | Designing Web Tutorials | 81 | 15 | |
| Citation Software (ProCite, etc.) | 116 | 16 | Citation Software (ProCite, etc.) | 75 | 16.5 | |
| Improving Document Delivery Services | 113 | 17 | Copyright Issues | 75 | 16.5 | |
| Web Page Design | 112 | 18 | Improving Access for Distance Learners | 67 | 18 | |
| Licensing Issues and Strategies | 111 | 19 | Web Page Design | 66 | 19 | |
| Improving Access for Distance Learners | 108 | 20 | Web Tools (Java, CGI Scripting, etc.) | 65 | 20 | |
| Budgeting Basics | 106 | 21 | Budgeting Basics | 63 | 21 | |
| Managing Staff | 95 | 22 | Managing Staff | 61 | 22 | |
| Kendall's tau-b | 0.657 | |||||
| Spearman's rho (Rs) | 0.824 | |||||
| Correlation is significant for both at the 0.01 level (2-tailed). | ||||||
Scatterplot and curve-fitting procedures indicated the relationship tended toward the linear but was not completely convincing in that role. Therefore a Spearman rank order correlation coefficient (rs ) and Kendall's tau were computed. For each the null hypothesis, that no significant relationship between the interest levels of the two groups existed (p < .01), was tested and rejected. Both tests showed significant correspondence between the groups. Similar worries and developmental needs affect us all. These results suggest that the same continuing education issues should be addressed both within and without conference programs. We also can't show from this data that changing meeting content to include the desires of non-regular attendees has the potential to convince them to attend ALA.
Three Topics of Greatest Interest
To confirm any findings from the Likert-scale questions and to invite other suggestions, three data wells were provided for each librarian to record the three topics of greatest interest. Some interpreted this to mean repeating items from the first set of choices. Others typed in their own ideas. A certain subjectivity pertains to analyzing such data. The reader is invited to visit the survey results, Question 23 in Appendix 2, to view all responses at the first level of summarization. Respondents reiterated two of the top choices enumerated above, information literacy in the sciences (top choice here) and improving liaison relations with academic faculty (second choice). The effect of electronic sources on libraries and collections fell to the middle ranks. Aside from that, the items of moderate interest above were of moderate interest in this group, and the items of low interest above were again of low interest here. Web tool use (Java, CGI scripting, etc.), adeptness at which is ostensibly a marketable skill, received no mention at all. Many university and college libraries seek coherence and security in their web sites by prescribing much of the organization and design. It is not unusual for librarians to provide content information only. Could this environment cause the lack of interest? Another explanation might be that science librarians want to develop this technical skill but do not look to their associations to teach them.When not reiterating choices from the Likert-scaled categories, unique suggestions were the rule. Eight individuals, however, mentioned alternative scholarly communication. SPARC and "scholarly communication" without the "alternative" generated some interest in the 2001 survey. Like the three most popular topics, alternative scholarly communication means a variety of things to a variety of people: free electronic journals, e-print servers, SPARC initiatives. Right now decisions are being made in libraries to embrace, support, ignore, denigrate, or participate. A whole army of specific skills and knowledge is employed in this activity, inviting a legion of continuing education ideas.
One respondent suggested, "Some brand new topic that I haven't even heard of yet." Professions use their attendance at national meetings to encounter the latest and newest, to alert themselves to the specks on the horizon. If STS only focuses on what people already want, it can't do that. How to respond to felt demand while providing a spyglass for the specks is an old but important problem.
Delivery Methods
Eight modes of continuing education were listed in the present survey. Respondents could mark any and all that appealed to them. A simple yes/no radio-button was provided for each mode. Their desires can be seen in Figure 2.
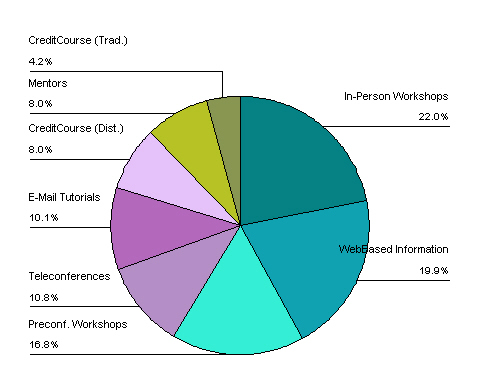
Total Points=286; Number of Respondents=91; Mean Points per Choice 35.75; Range=12 - 63
Figure 2's pie-chart displays the choices and the percentage of the 286 total "votes" each received. Clearly workshops and web-based information garnered the greatest interest. Both in-person and preconference workshops, which of course could be the same thing, were found acceptable. Moderate interest was shown in teleconferences and e-mail tutorials, somewhat less in distance-education for-credit courses and mentors. Fewest evinced interest in traditional credit courses as a source of continuing education. The relatively small number of votes for credit courses place science librarians' interests in contradistinction to other professions' requirements. Physicians, nurses, and other groups depend on continuing education credits to maintain licensure and/or to demonstrate understanding of current practice. Closer to home, the Medical Library Association sponsors and accredits {formal continuing education}.
The Special Libraries Association has recently launched what it calls a "learning community" to help its members plan, track, and document continuing education, including formal courses on the web (Lowery 2004).
Of those who answered this question (n=90), about 57% indicated they regularly attended ALA. For planning purposes it would be desirable to know what difference if any this made in preferred delivery method. Nonparametric procedures were chosen to compare these two groups after curve estimates and a scatter plot failed to show linearity between the respective delivery method scores. Because of the number of rank ties and other factors related to statistical assumptions, only a limited number of common tests could be employed.
A Spearman rank order correlation coefficient (rs) was calculated comparing delivery-method scores. The null hypothesis, that there was no difference (p < .05) between those regularly attending ALA ("ALA Attendees") and those not regularly attending ("Non-Regular ALA Attendees") was tested. Table 2 shows the comparative rankings of the groups.
Table 2. Preferred Delivery
Method, ALA Attendees vs. Non-Regular ALA Attendees |
||||||||
ALA Attendees (n=52) |
Non-Regular ALA Attendees
(n=38) |
|||||||
| Rank | Delivery Method | Count | %Attendees | Rank | Delivery Method | Count | %Non-Attendees | |
| 1 | In-Person Workshops | 37 | 71.15% | 1 | Web-Based Information | 26 | 68.42% | |
| 2 | Preconf. Workshops | 34 | 65.38% | 2 | In-Person Workshops | 25 | 65.79% | |
| 3 | Web-Based Information | 31 | 59.62% | 3 | Teleconferences | 16 | 42.11% | |
| 5 | Teleconferences | 15 | 28.85% | 4 | E-Mail Tutorials | 14 | 36.84% | |
| 5 | E-Mail Tutorials | 15 | 28.85% | 5 | Preconf. Workshops | 13 | 34.21% | |
| 5 | Mentors | 15 | 28.85% | 6 | Credit Courses (Dist.) | 9 | 23.68% | |
| 7 | Credit Courses (Dist.) | 14 | 26.92% | 7 | Mentors | 8 | 21.05% | |
| 8 | Credit Courses (Trad.) | 7 | 13.46% | 8 | Credit Courses (Trad.) | 4 | 10.53% | |
| Spearman's rho (Rs) 0.714285714 | ||||||||
Except in the case of preconference workshops no more than two ranks separated each continuing education method from itself on the opposite list. Even so, the null hypothesis was not supported. A correlation coefficient of 0.714 was found, not quite the 0.738 needed to believe these two groups wanted the same thing.
What was different about these groups? It is perhaps easiest to dispose of the lowest-scoring methods first. Both groups agreed that mentors and both kinds of credit courses (distance and traditional) failed to appeal to them, although mentors were more acceptable to the attendees. This agrees with the overall score in Figure 2. While no reasons for the preferences were given, one cannot fail to note these are the methods that usually involve serious commitment for an extended time period.
At the opposite end are the most highly scoring preferences. Extended personal involvement is not required. The attendees' first two choices (one and two, lowest numbers representing greatest preference) were both types of workshops. The non-attendees ranked these two and five. What made the difference? The nonattendees' first, third, and fourth choices all could be accomplished at home or at their places of work: web-based information, teleconferences, and e-mail tutorials. It may be that their "preferences" are based not on personal desires but rather on their ability to find funds or to take leave. Institutional support or lack thereof may lurk behind these choices. Havener and Stolt (1994) have shown this to make a significant difference. In-person workshops are high on both lists. These may be accomplished at venues other than ALA, perhaps closer to home, cheaper, or more specific to needs of the individual. Technical skills useful to librarians such as web-page markup and software use can be learned without attending expensive national professional conferences. As for web-based information (third choice for attendees, first for nonattendees), it is available seven days a week through the average workstation, whenever it is needed. Librarians use the Internet all week. Going to the Web fits in with their way of doing things. Cost, skill, immediacy, and habit all point to using the Web. As Miller (1987) pointed out, "... in the end it is not what has been taught that matters, but what has been learned." Miller was deploring the content/teacher-centered courses dominating continuing medical education, pleading for a need/student-oriented approach instead, focusing on "things that matter." What can be more student and need oriented than repairing to the Web to fulfill needs?
Varlejs (1999) found that three times as much time was spent by librarians on self-directed study than on formal continuing education. Institutional size and support for continuing education were not predictors of the time spent on self-directed study. These findings articulate well with the findings above. Both groups in the STS 2003 study, 59.62% of regular attendees and 68.42% of non-regulars, rated the Internet highly. While a certain amount of Internet-based learning is formal, much of it is not, and is available to those with and without travel budgets.
From the evidence of the teleconferencing and e-mail tutorials scores, less than half of each group was interested in these methods, usually much less than half. Still, these methods have an audience. In the case of teleconferences, a widely dispersed group may interact. E-mail tutorials are inexpensive after they are developed, can be done at any hour of the day, and do not require more than standard technology.
What do these observations mean for STS? It means that its continuing education web pages should be able to make valuable contributions to the section. It is useless to insist on more formal methods, since a clear majority of respondents find the web to their liking as an information source. It means that STS should continue to seek the best presenters to discuss the most pressing issues at its ALA workshops, continuing to tie at least a goodly number of these sessions as closely as possible to current needs. (This author is not suggesting, however, that the best basic research in science librarianship, a scarce enough commodity, lose presentation venues because of this!) Somehow in all of this the Section must avoid "me-tooism," the unsightly lurching from shallow fashionable topic to shallow fashionable topic, but rather be ready to present the next important topic looming on the horizon.
On the Issue of Mentors
The low score for interest in mentors may mean that on-site mentors who can share coffee breaks with new librarians are in greater demand than distant experts. Another likely explanation is that most science librarians are quite experienced. Table 3 compares years since library school with interest in being mentored.
Table 3. Mentoring as a Preferred
Source of Continuing Education. |
||||
| Yes | No | Total | ||
| Years Since Graduation from Library School | 0 to 5 | 15 | 15 | 30 |
| 6 to 10 | 4 | 13 | 17 | |
| 11 to 15 | 2 | 12 | 14 | |
| 16 or more | 2 | 28 | 30 | |
| Total | 23 | 68 | 91 | |
No elaborate statistical method is needed to see that of the approximately one-third of survey takers who have zero to five years of experience, half are interested and half are not. The more experienced librarians are not. This unsurprising finding supports the current desire by some members of STS to be more pro-active in pairing new members with experienced librarians from the start. The problem is to convince the new members to take action.
The survey asked two more questions about the mentor program, the first if the respondent was aware of the STS Sci/Tech Library Mentors program, and the second if he or she had used it. Fifty-five percent had heard of it, but no one claimed to have availed himself or herself of its benefits. This emphasizes the need for STS to learn if the kind of mentoring it offers is the kind desired. It may also be that in the press of day-to-day duties people do not always avail themselves of what they know to be good.
Other Survey Questions
The Special Libraries Association has for some time been interested in working with other professional organizations to facilitate continuing education (Ginsburg 1998). For this survey STS and SLA worked together to develop and include the question, "Would you attend pre-conference training opportunities and/or workshops of the Special Libraries Association (SLA) if you could attend at SLA member rates?" Eighty-three respondents provided a yes or no answer. Fifty-eight percent said yes, forty-two said no. Overall, that meant that 52% of the total survey takers responded in the affirmative. The survey did not ask who was a member of SLA already, so these findings should be interpreted with care. Whether this would encourage greater overall attendance at continuing education events, bleed off a certain number of dollars from ALA or local workshops, or merely save a few dollars for a certain number of individuals are questions whose answers lie outside the scope of this survey.
Conclusions
For the science librarians who answered the 2003 Continuing Education Survey, grappling effectively with the changes and pressures affecting libraries was clearly the focus of their interests. The "write-in" vote for alternative scholarly communication only emphasized this message. Both regular ALA-attendees and non-regular attendees agree on current needs. As a result, changing the content of conference programs to target non-regular attendees may not increase attendance. The two groups differ in ranking preferred delivery modes, but both prefer methods requiring only limited involvement on the part of the recipients. Little interest was shown in formal coursework. A small but identifiable group selected mentors as a source of education. It remains to be seen whether STS' program is what these librarians had in mind.
Acknowledgements
The author wishes to thank Christina Desai, Southern Illinois University, for her help and encouragement analyzing and interpreting the data. She also wishes to thank Marian Burright, The University of Maryland, for collecting the survey data.
References
Desai, C.M. 2002. Continuing education needs of science and technology librarians: Results of the 2001 STS Continuing Education Committee Survey. Issues in Science and Technology Librarianship 34. [Online]. Available: www.istl.org/02-spring/article5.html. [Feb. 4, 2004]Ginsburg, C.L. 1998. Looking ahead for professional development. Information Outlook 2(1):39.
Havener, W.M. & Stolt, W.A. 1994. The professional development activities of librarians: Does institutional support make a difference? College & Research Libraries 55(1):25-36.
Lowery, J. 2004. The future of professional development: A vision and a roadmap. Information Outlook 8(2): 32-3.
Miller, G.E. 1987. Continuing education; what it is and what it is not. JAMA, The Journal of the American Medical Association 258(10):1352-1384.
Smith, D. & Burgin, R. 1991. The motivations of professional and paraprofessional librarians for participating in continuing education programs. Library and Information Science Research 13(4): 405-29.
Varlejs, J. 1999. On their own: Librarian's self-directed, work-related learning. Library Quarterly 69(2):173-201.
Appendix 1. STS Continuing Education Survey 2003 Questions
Appendix 2. STS Continuing Education Survey: Results
| Previous | Contents | Next |
