Infer More, Describe Less: More Powerful Survey Conclusions through Easy Inferential Tests
Christy Hightower
Science and Engineering Collections Coordinator
Science & Engineering Library
christyh@ucsc.edu
Kerry Scott
Head of Collection Development
University Library
scottk@ucsc.edu
University of California, Santa Cruz
Santa Cruz, California
Abstract
Many librarians use data from surveys to make decisions about how to spend money or allocate staff, often making use of popular online tools like Survey Monkey. In this era of reduced budgets, low staffing, stiff competition for new resources, and increasingly complex choices, it is especially important that librarians know how to get strong, statistically reliable direction from the survey data they depend upon. This article focuses on three metrics that are easy to master and will go a long way toward making librarians' survey conclusions more powerful and more meaningful: margin of error (MoE), confidence Level (CL), and cross-tabulation table analysis. No complex mathematics or expensive software is required: two simple and free online calculators are introduced that will do the math for you. This article puts the power of improved survey analysis within reach of every librarian and includes eight recommended best practices.
Introduction
How many times has your library surveyed its user population in the last two years? How many decisions have gone forward, or how often has money or staff been allocated, based on the results of those surveys? How many times have you heard your colleagues ask, "What's the margin of error (MoE) for this survey?" Or "Is the comparison of the faculty answers to the graduate student answers statistically significant?" If you answered "many" to questions one and two and "none" or "seldom" to questions three and four, we would like to make a case for a renewed appreciation and understanding of the margin of error, confidence level, and cross-tab analysis in your library.
Many of us use surveys to help us make decisions about how to spend money or allocate staffing resources. What some of us are less good at is ensuring that the conclusions we draw from our data are statistically significant. In an era of declining resources, the need to make statistically reliable arguments for allocation or placement of funds is especially important. We also need to be as confident as possible that we are deploying our human resources in the areas where they will provide the most bang for our declining bucks. Another reason for "upping our game" when it comes to applying survey statistics is to increase our credibility with our academic clients (faculty library committees and advisory boards, campus administrators who have input into library budgets, etc.) who routinely pay more attention to statistical analysis than librarians typically do. Increasingly, many of us find ourselves in the difficult position of competing against our own academic customers for diminishing campus resources. The ability of the library to put forward statistically valid proposals for funding in this competitive arena is especially important.
The good news is you don't need to be a professional statistician to understand the basics of recognizing accurate survey conclusions. In this article we will define and focus on three metrics that are easy to master and will go a long way toward making your survey conclusions more powerful and more meaningful: margin of error (MoE), confidence Level (CL), and cross-tabulation table analysis. And you won't even have to fully understand the math or buy expensive software: we will introduce two simple and free online calculators that will do the math for you. The goal of this article is not to numb your brain with a complicated lesson on statistics. Instead it is to give you some simple information and a few key tools that will improve how you analyze your own survey data and make you a more informed consumer of the survey results of others so that you may improve the quality of the actions taken based upon survey results.
We have organized what you need to know into eight recommended best practices. These are described below, and are summarized at the end of this article in a checklist for future reference.
The Difference Between Descriptive and Inferential Statistics
Let's begin with a quick orientation to some important statistical distinctions. It is really helpful to know that, generally speaking, there are two kinds of statistics: descriptive statistics, and inferential statistics.
Descriptive statistics are those that organize, summarize, and display data collected in a study or survey. They do not test hypotheses about, or compare possible relationships between and among the variables (Rubin 2010). Descriptive statistics include but are not limited to, percentages, the arithmetic average, and the median (the middle value in a ranked list of values). Put simply, they describe the data you have collected.
Inferential statistics are those that are "used to assess the probability of sampling error and that go beyond describing sample data in an effort to make inferences about a population" (Rubin 2010). Inferential statistics include the margin of error and statistics like the chi-square test that analyze the possible relationships among the variables, such as the relationships among variables in a crosstab table. (More about chi-square tests and crosstab tables later). In other words, they allow you to infer relationships between and among the data you have collected and the larger population from which your sample comes.
It's important to know about these two kinds of statistics because evidence of inferential statistics being applied to library survey data analysis is sometimes hard to find in the reports, articles, and posters that draw conclusions from the data presented. Most often, descriptive statistics, simple percentages of the kind supplied by Survey Monkey for example, are offered as "stand ins" for inferential statistics. While the temptation to rely on descriptive statistics can be strong, it needs to be resisted. This is especially true when really important decisions and/or scarce resources hang in the balance.
Descriptive statistics alone cannot tell you what is going on with your entire population unless everyone in your entire population (not just in your sample) not only receives your survey but actually fills it out and returns it. The best example of a survey with that kind of response rate would be a census. And, unless we are truly only interested in the small set of people who answered our survey, it is almost always the larger population that we really care about and want to know about.
Inferential statistics help us take into account the probability of sampling error, or the possibility that the differences between variables that we are measuring in our sample could have occurred by chance. And, because we are curious about the relationships among our variables (comparing faculty to students, comparing those who had library instruction to those who did not, etc.) we need a way to relate these sample comparisons to our larger population. Really, for most library surveys, the answers that only inferential statistics can provide are the ones we seek to inform our decision-making processes.
Unfortunately, the Survey Monkey software that many of us rely upon so heavily to administer and analyze our surveys provides no inferential statistics, only descriptive ones. In reality, the "analyze" section of Survey Monkey might more aptly be titled the "describe" or "summarize" section.
Recommended Best Practice #1: Inferential Statistical Tests: To be more certain of the conclusions drawn from survey data, use inferential statistical tests. Only report conclusions about your whole population (not just the sample population) that are verified by inferential tests. The inferential tests should be taken seriously and should be documented alongside your survey data and analysis so that the validity of the conclusions can be adequately weighed by your peers who may want to build upon your work, and by the decision makers who may take actions based upon your results.
The Margin of Error (MoE)
One key inferential test is applying the margin of error (MoE). Margin of error is often reported in news stories and most of us think about it in relation to political polls. For example, Candidate A is ahead of Candidate B, plus or minus 5%. That 5% is the margin of error. In the simplest terms, the MoE is the calculation that indicates how close your sample population -- the people who actually replied to your survey -- is to the larger population, or, the people who didn't answer your survey question(s). For example, if your campus has 15,000 FTE, no matter what incentive you offer to fill out your survey, it is unlikely that 15,000 people will respond. Instead, you'll get some small percentage of that 15,000. Without knowing the margin of error, you can only discern what the people who answered your survey think or want -- not what the remaining people think or want. And, as discussed above, in libraries, it's almost always those people who you didn't hear from that you want to know about. The margin of error needs to be determined to help you make that assessment. Luckily there are free online calculators that will determine your MoE for you. Use one that is specifically designed for survey data because the multiple choice nature of survey answers makes the MoE formula a bit different than for other types of research. We recommend Raosoft's margin of error/sample size calculator freely available on the web site at http://www.raosoft.com/samplesize.html.
Sample Size in Relation to Margin of Error and the Confidence Level
We really cannot discuss the margin of error further without first giving attention to the interrelated issues of sample size and confidence level. The sample size is the number of people from whom you receive responses to your survey. It is very seductive to think that a limited group of responses to a survey would suffice, especially when obtaining a larger sample requires a greater time commitment and a larger cost. But a lower sample size also means you will have a higher margin of error.
Many librarians have been introduced to sample size requirements from their experiences with the web usability testing world, and to the work of Human Computer Interaction expert Jakob Nielsen in particular. Because his work is so often quoted by librarians to justify their survey sample size, it is worth a closer look.
In 2000, Jakob Nielsen suggested that five people were enough to test any web site for usability issues (Nielsen 2000). Web site usability issues include things like navigation buttons that people can't see or link labels that are confusing to people, etc. This web site testing is typically accomplished through individual interviews or in a focus group setting where people try out the web site itself, rather than with a multiple choice survey. Notably, by 2006, Nielsen had upped the minimum number of people needed to 20 and added the margin of error test to his position statement (Nielsen 2006). His central hypothesis is that after a small number of people test the web site, the number of new web site usability issues you discover decreases exponentially and if you make your testing process iterative -- that is, test the web site with five people, fix the problems identified and then test with five more people -- you'll have a better testing process, discover the most common errors in the web site design and accomplish quality assurance in a more cost effective and efficient manner. His approach -- testing a web site with only 20 people -- assumes a 90% confidence level and a 19% margin of error. You probably wouldn't want that wide a margin of error for your survey results unless the stakes were low or the results were very clear: either overwhelmingly in favor or opposed to one option; for example between 80% and 90% of your sample group was either for or against the option in question. And a 90% confidence level may not work for you either.
What does a 90% confidence level tell you? The confidence level is a percentage that you choose that describes how much "certainty" you want within your survey results. The confidence level is the estimated probability that the larger population's answer to a question will be within the "norm" of the survey response group's answer to the question.
The margin of error determines the range of the "norm" for your survey results -- it's that plus or minus "x" percent. So the confidence level and the margin of error are closely tied to each other. Nielsen's 90% certainty may sound high, but most researchers choose a 95% confidence level, and some go as high as 99%. But a higher confidence level requires a larger sample size to keep the margin of error low. The smaller the sample size is, the greater the margin of error. This is why Nielsen's small sample size of 20 web site testers results in a high 19% margin of error and a relatively low confidence level.
The best way to illustrate the interconnectedness of the MoE, sample size and confidence level, is to make use of the online survey-specific sample size calculator we recommend (Raosoft's calculator at http://www.raosoft.com/samplesize.html) with a specific survey example. Let's say that I have been given a generous one-time gift of funds to purchase e-book readers. I have a campus population of 15,000 FTE and I want to survey that population about what e-book readers they prefer (iPads or Kindles or Kobos). Before I spend time and resources crafting and publicizing my survey, I can use the calculator to tell me how many people I need to hear from to know if I can reasonably rely on my survey results.
In this hypothetical case, the stakes are high not only because a substantial amount of money is involved and of course I want to make the best choice possible, but also because the donor is watching closely to see how I spend it. I need this e-book reader purchase to be a great success if I ever hope to get money from this donor again. Because the outcome is important, in this case I want a 95% confidence level (generally people pick a 90, 95 or 99% confidence level, depending upon how crucial the decisions are that will be based upon the survey results). Once you choose your confidence level, stick with it. Don't change it unless the reason you are doing the survey changes. But know that higher confidence levels require a larger sample size if you also want to keep your margin of error reasonable.
In this case, I am aiming for a margin of error of +/- 5%. A 5% margin of error means the larger population's responses can be 5% above or below the sample response rate. A 95% confidence level means I don't want my results to be outside of that 5% +/- margin of error more than 5% of the time (100% confidence minus my 95% confidence level = 5%). When I enter my pre-survey desired margin of error, desired confidence level and total population size (not sample population size) in the calculator, it tells me I need 375 people to respond to my survey in order to get a 5% MoE and a 95% confidence level. [See Figure 1]. If I think 375 people are likely to respond to my survey, or if I have the resources needed to beat the bushes to get that high a response rate, I can move forward with my survey with confidence -- at least, 95% confidence.
Figure 1. Use of the sample size/margin of error calculator before
the survey is conducted in order to determine the target sample size to aim
for.
Now, say I conduct my survey and I only receive 185 responses -- half of my goal. Is my study now useless or invalid? Or are 185 responses good enough? To find out, I need to know how large my margin of error is with this smaller sample size. I can return to the same sample size calculator I used before, but this time I use the "alternate scenario" section at the bottom. Here I edit the first sample size box and put in my real sample size of 185. Now my margin of error moves up from a hypothetical 5% to the real value of 7.16%. In this case, I have not changed my confidence level, because my survey is still "high stakes." [See Figure 2].
Figure 2. Use of the sample size/margin of error calculator after
the survey is conducted to determine the real margin of error with the actual
sample size you obtained.
To know how concerned I need to be about this rise in my margin of error, I need to examine my results a little more closely. But first, let's note the best practices recommended so far.
Recommended Best Practice #2: Confidence Level (CL). Choose your desired confidence level (typically 90%, 95%, or 99%) based upon the purpose of your survey and how confident you need to be of the results. Once chosen, don't change it unless the purpose of your survey changes. Because the chosen confidence level is part of the formula that determines the margin of error, it's also important to document the CL in your report or article where you document the margin of error (MoE).
Recommended Best Practice # 3: Estimate Your Ideal Sample Size Before You Survey. Before you conduct your survey use a sample size calculator specifically designed for surveys to determine how many responses you will need to meet your desired confidence level with your hypothetical (ideal) margin of error (usually 5%). Use this pre-survey target sample size as a reality check on the effort that might be required to undertake the survey to get close to that ideal sample size. Do not assume that a small sample size will be sufficient. Smaller sample sizes result in larger margins of error. We recommend using the Raosoft sample size calculator at http://www.raosoft.com/samplesize.html for the analysis of multiple choice survey data.
Recommended Best Practice # 4: Determine Your Actual Margin of Error After You Survey. Use a margin of error calculator specifically designed for surveys, such as the Raosoft online calculator, with your real sample size after your survey is complete to ascertain the real margin of error for your sample data, given the confidence level you selected earlier. The actual margin of error will be critical in helping to determine he validity of your conclusions.
Using the Margin of Error to Validate Conclusions
Now, let's return to our example survey about e-book readers where our target sample size was 375, but I actually only got 185 surveys filled out, and the margin of error went from the ideal target of 5% to an actual level of around 7%. If I had, of the 185 people who responded, a breakdown of 65% preferring iPads and 30% preferring Kindles and 5% preferring Kobos, I would need to factor in the new, real MoE of 7% to see if these numbers tell a definitive story or if the survey results are too close to call. So, the margin of error tells me that the 65% vote for iPads could really be as high as 72% (65 + 7) or as low as 58% (65 - 7) in the population as a whole. And the Kindle vote could be as high as 37% or as low as 23%. This analysis shows that in this case there is no overlap between the iPad group and the Kindle group at either the low or the high end after the real MoE is applied, which means that I can confidently infer that in my campus population as a whole, iPads are the preferred e-book reader.
But, if the numbers were closer, say, 50% preferring iPads, 45% preferring Kindles and 5% preferring Kobos, my margin of error tells a very different story -- now the iPad and Kindle groups overlap when I apply the +/- 7% margin of error. So, in this alternate case, the statistically valid conclusion I would report is that there is no clear preference between iPads and Kindles in my campus population as a whole. I can also conclude that Kobos were not favored.
These examples show that while you may initially aim for a margin of error of 5% the important thing is to determine what your real margin of error turned out to be after your survey closes. Then use the real margin of error to determine what conclusions are valid. If your real margin of error was larger than you would like, you could try to increase your sample size which would lower your margin of error. But if that is not possible, you can only report the conclusions that you get after analyzing the results with the margin of error that you have.
Recommended Best Practice #5: Use your real margin of error to validate your survey conclusions. Add and subtract the margin of error from the percentage value of each survey question response to compare the overlap between possible outcomes for your population as a whole. Use this range to determine if the result for your larger population is clear or if it is too close to call. If it is too close to call you can increase your sample size to reduce your margin of error, otherwise you must report that your survey was inconclusive for that question.
Cross-Tabulation Table Analysis and the Chi-Square Test
Because librarians are almost always asking questions about the relationships among the variables in our surveys, (comparing faculty responses to student responses, responses from those who had library instruction to those who did not, science researchers' preferences to humanities researchers' preferences, etc.), another tool that is of particular use is cross-tabulation table analysis.
Cross-tabulation (or cross-tab) tables show the relationships among survey variables in a summarized matrix display. For example, Table 1 shows a cross-tab table of data from a survey sample that explores the relationship between researcher age and the article database that they prefer. These tables are also called contingency tables when they display category data (like multiple choice survey answers). When they are produced by spreadsheet software such as Excel, they are called pivot tables. Crosstab tables can be very useful in analyzing survey results because they allow you to dig deeper and correlate the answers to two survey questions at once. This can focus your attention on possible relationships that might otherwise remain obscured. These tables are also very easy to create. The professional ("for fee") version of the Survey Monkey software provides the option to quickly create crosstab tables from any combination of questions in a survey with just a few mouse clicks (See Figure 3).
Figure 3. Location of the link in the Analyze Results section of Survey Monkey for creating crosstab tables.
For example, let's say I have used Survey Monkey to administer a survey of my campus researchers to find out which article database they like better: Web of Science or Google Scholar. One of my survey questions asks them which database they prefer. 81 researchers prefer Web of Science, 80 researchers prefer Google Scholar, and 38 people had no preference for either database. I want to dig deeper, and I wonder if younger researchers prefer Google Scholar. I have data about the researcher's age from another question in the same survey which tells me that 106 of the researchers responding were 40 years old or younger, while 93 researchers were over 40 years old. Now I need a crosstab table to link the specifics of those two questions together, to compare the age of each researcher who answered the survey with their specific database preference. So I go to the Crosstab Responses section of Survey Monkey and create a crosstab table like the one shown in Table 1. In the table, the rows match the data from one question (database preference) while the columns match the data from the other question (researcher age).
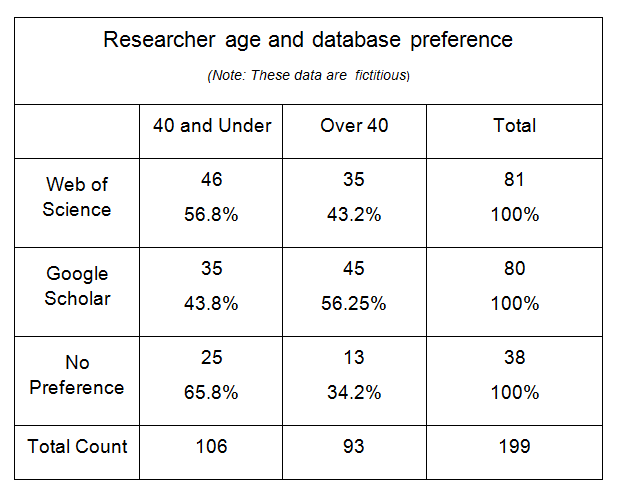
Table 1. Cross-tabulation table of sample data showing researcher
age and database preference. An inferential test such as chi-square needs
to be done on this data before any conclusions can be drawn about the characteristics
of the population that this sample represents.
Librarians beware, however, because the important thing to know about crosstab tables is that they contain only descriptive statistics (frequency counts and percentages) about the survey sample. The creation of the table itself does not provide any inferential statistics.
Does Table 1 indicate that actually on my campus younger researchers prefer Web of Science while older researchers prefer Google Scholar (the opposite of my initial guess)? Without an inferential test, I don't yet know what conclusions I can draw from the sample data in Table 1 about my campus population as a whole.
Because the crosstab table only has descriptive numbers about the survey sample there is no way to determine from the table values whether any of the differences between researcher age and database preference represented by the counts in each cell of the table are statistically significant, or, in other words, whether the sample results are likely to represent the characteristics of the larger population or if the characteristics of the sample are due to chance. Consequently, the counts or percentages in crosstab tables should not be presented as evidence of a conclusion about the larger population (all of my campus researchers) without the additional application of inferential statistics. This is the lens through which you should be viewing crosstab tables.
And this is where the chi-square test comes in. The chi-square test is one of several inferential statistical tests that can be applied to crosstab table data. As Gillian Byrne explains, "A chi-square is a test which looks at each cell in a cross tabulation and measures the difference between what was observed and what would be expected in the general population. It is used to evaluate whether there is a relationship between the values in the rows and columns of a cross tab, and the likeliness that any differences can be put down to chance" (Byrne 2007).
While a chi-square test will not tell you the strength of the relationship between the two survey variables in a crosstab table (in this case researcher age and database preference) it will tell you if one exists. There are other inferential tests that can assess the strength, but if you only have the time to apply one test to your crosstab tables, the chi-square test is a good one to do. It is quick and easy and is commonly used for crosstab table analysis. Because it is commonly used, there are several free online calculators that will do the math for you.
Recommended Best Practice #6: Apply the Chi-Square Test to your Crosstab Tables to see if there are relationships among the variables that are not likely to have occurred by chance, to make sure that your conclusions reflect the characteristics of the whole population and not just your smaller sample.
Most survey analyses result in many crosstab tables, each of which will need to be tested separately. We recommend this very simple, free, online chi-square test calculator for the analysis of crosstab survey data, from T. Kirkman at the College of Saint Benedict and Saint John's University: http://www.physics.csbsju.edu/stats/contingency_NROW_NCOLUMN_form.html. Or, for those of you ready to go to the next level, this free online calculator from Vassar University offers more options: from the home page at http://vassarstats.net/ choose "Procedures Applicable to Categorical Frequency Data" then choose "Chi-Square, Cramer's V and Lambda for a Rows by Column Contingency Table."
The fine print: note that you need to use the frequency counts, not the percentage values, from each cell in your crosstab table in the calculator. Also, none of your table cells can have an expected frequency of zero (Byrne 2007), and if your cells have an expected frequency of less than five, the chi-square test may be invalid (Wildemuth 2009). Don't worry, the calculator figures out the expected values for you. All you have to enter in the online calculator are the sample values from your survey. If the expected counts generated by the calculator are five or above, you are good to go. If you have small counts in each cell of your crosstab table you may benefit from using Fisher's Exact Test instead, see the free online calculator for that at http://in-silico.net/statistics/fisher_exact_test.
Reading and Reporting a Chi-Square Test
The results of the chi-square test of the data in Table 1 as reported by our recommended online calculator are shown in Figure 4. The final number to focus on in a chi-square test is the p-value, or probability value. The convention is that when the p-value is less than .05 that indicates that there is a statistically significant relationship between the row and column variables, and when the p-value is greater than .05 there is no statistically significant difference or relationship between the row and column variables. Statistically significant means the relationship is not likely to have occurred by chance, so it would actually reflect the characteristics of the whole population and not just the study sample. However, being statistically significant does not prove a cause and effect relationship between the row and column variables. You can speculate or hypothesize about cause and effect around a statistically significant relationship, but you should not offer the results of a chi-square test as proof of causality (Nardi 2003).
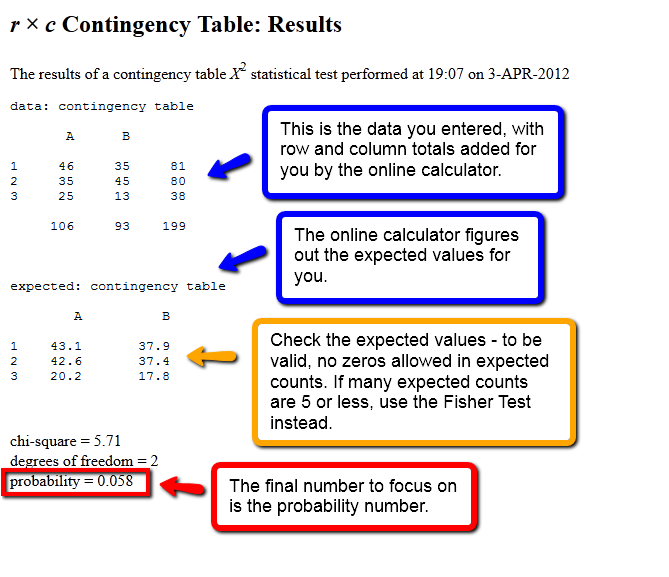
Figure 4. The results of the chi-square test performed on the data
from Table 1, using Kirkman's online calculator.
P-value greater than .05: If we apply the chi-square test to the data in Table 1, it yields a p-value of 0.058, which is a shade greater than .05. Therefore the standard conclusion from the data in Table 1 is that the survey showed no statistical relationship between researcher age and database preference.
P-value less than .05: If you have a p-value of less than .05 for a crosstab table then you know there is a relationship, but you will need to look more closely at the data to see where the relationships are. How do you do this? There are mathematical approaches to studying the nature of the relationships confirmed by chi-square tests that are beyond the scope of this article. Instead, we recommend that you proceed by examining the data. Graphing the data may also help to reveal the patterns. However, graphing the data is not a substitute for applying a chi-square test. Depending upon the scale used, graphs may show or accentuate something that looks like a relationship that may not hold up under the analysis of a chi-square test. Also remember that chi-square tests do not indicate the strength or the cause of the relationship. Always report the chi-square p-values somewhere close to the conclusions they support in your report.
Wiggle Room
Is there any "wiggle room" allowed in interpreting p-values? What if your p-value is .06 (as in our Figure 4 example rounded up) or .04? Is that "close enough"? One should be conservative in interpreting research studies, which is why the convention for the p-value cutoff is set at 95% likelihood not to have occurred by chance (as opposed to 90% or 80%). However, this .05 cutoff is arbitrary, and is based upon statisticians' conventions, not on scientific facts. Ideally, one would use p-values as guides to focus in on what needs further research, which is what the originator of the p-value, Ronald Fisher, apparently intended, as reported by David Salsburg in his book The Lady Tasting Tea:
"Reading through Fisher's applied papers; one is led to believe that he used significance tests to come to one of three possible conclusions. If the p-value is very small (usually less than .01), he declared that an effect has been shown. If the p-value is large (usually greater than .20) he declares that, if there is an effect, it is so small that no experiment of this size will be able to detect it. If the p-value lies in between, he discusses how the next experiment should be designed to get a better idea of the effect (Salsburg 2002)."
Unfortunately, librarian-practitioners usually do not have the luxury of an environment where multiple tests (surveys) can be carried out until certainty is assured. We strongly recommend that librarians stick to the generally accepted standard of .05 as the cutoff for evaluating p-values. However, it is reassuring to know that statistical concepts such as p-values are "...not themselves scientific facts, nor did they arrive to us from Mt. Sinai. They are the results of debates which are not yet finished" (Ghaemi 2009). You might be able to justify a conclusion based on a p-value cutoff that deviates somewhat from this .05 convention, but if you do, you will need to be able to articulate a reasonable case for doing so and you certainly should not do so unremarked.
Recommended Best Practice #7: Reading and Reporting Chi-Square Tests of Cross-Tab Tables:
- Use the .05 threshold for your chi-square p-value results in cross-tab table analysis, particularly if the conclusions will be used to make high stakes decisions. However, if you consciously choose to use a different threshold, clearly state your reasons for doing so in your conclusions.
- If the chi-square p-value is larger than the threshold value, no relationship between the variables is detected. If the p-value is smaller than the threshold value, there is a statistically valid relationship present, but you need to look more closely to determine what that relationship is. Chi-square tests do not indicate the strength or the cause of the relationship.
- Always report the p-value somewhere close to the conclusion it supports (in parentheses after the conclusion statement, or in a footnote, or in the caption of the table or graph) when communicating with decision-makers or library peers. For example p=.035, or p < 0.001. Your readers need this information to assess the accuracy of your conclusions.
Non-Random Samples and Bias
Because most librarians are practitioner-researchers (rather than theoreticians) who are doing imperfect studies with limited resources, we need to say a few words about non-random samples, survey design, and bias.
The large "elephant in the room" throughout this entire article is the fact that the inferential statistics we are advocating for are technically only valid for random samples, which library survey samples rarely, if ever, are. Sending the link to your survey out to as many e-mail lists as you can does not result in a random sample, because even if you actually reached everyone in your study population (in itself doubtful) those who respond have self-selected themselves, you did not select them randomly. Obtaining random survey samples is more difficult and time consuming than obtaining convenience samples, and as a consequence, library survey samples are almost never random enough.
Make no mistake, obtaining random samples is still the absolute best practice/gold standard in order to infer the characteristics of the larger population from the sample. If you received a large government grant, for example from the Institute of Museum and Library Studies, to fund your study, or, if you are a manager who is directing a massive number of librarian-hours to design and deploy a survey that will have far reaching consequences in terms of changing services or spending money (particularly on a consortia or multi-library scale), then you really should be making a serious effort to obtain a random sample. There are many books that explain how to undertake random sampling. Chapter 13 of Barbara Wilemuth's book Applications of Social Research Methods to Questions in Information and Library Science is a good place to start (Wildemuth 2009).
So if it is not feasible to obtain a random survey sample, are you off the hook for doing inferential statistics? If your sample is not sufficiently random, an inferential test may overstate the accuracy of the results, because it only considers random error. The test cannot consider biases resulting from non-random error (for example only getting survey responses back from those who have an axe to grind, which is one danger of self-selected respondents). On the other hand, not doing any inferential tests and instead making inferences about the larger population from descriptive statistics alone is pretty much guaranteed to overstate the accuracy of the results, in our opinion. It is our contention that applying the margin of error to your data, and performing a chi-square test on your crosstab tables, will act to eliminate the more dubious conclusions, and will focus attention on a smaller, more sound subset of conclusions from the survey. We posit that the conclusions derived from survey data tested with inferential statistics are still more likely to be accurate in reflecting the characteristics of the entire sample population than those not tested, even when the sample is not random.
Bias is another issue that is not solved by applying inferential tests. Non-random sampling is one form of bias, but poorly constructed survey questions can also introduce bias. Of course, applying inferential tests to your data does not free you from the obligation to do your best to limit bias in your survey as much as possible, whether caused by your sampling method, by the way you frame your questions, or other survey design and implementation factors. There are several sources for tips on writing unbiased (or at least less biased) survey questions. Here is one example: the Top 12 Best Survey Practices from Constant Contact available at http://img.constantcontact.com/docs/pdf/Top12SurveyBestPractices.pdf.
Transparency is crucial. If you have a non-random sample you will need to be particularly diligent about documenting your survey method and any other possible sources of bias and error due to your survey design in your research report. Communicating this information is essential so that those who read your report can properly assess the risks of acting upon your conclusions.
Best practice #8 - Document any known sources of bias or error in your sampling methodology and in your survey design in your report, including but not limited to how your survey sample was obtained.
Conclusion
As a survey-driven profession, we need to be aware of the limitations of surveys and we need to work to ensure that the surveys we conduct and the conclusions we draw from them are as statistically valid as we can make them. Hopefully we have shown the importance of applying inferential tests to library survey data to ensure that the conclusions reached from the small survey samples we obtain accurately reflect the characteristics of the larger populations that we really want to know about. As consumers of survey data, and particularly in our role as decision makers, we need to be looking for the inferential statistics that support the conclusions that are derived from the survey data we review. We should not hesitate to request inferential statistical tests if they are not in evidence.
Mastering the application of the margin of error, confidence level, and chi-square tests of cross-tab tables is within the reach of every librarian. Applying the eight best practices presented in this article will go a long way toward making librarian's survey conclusions more powerful and more meaningful. Even if you hire a consultant to analyze your survey data for you, the knowledge of the statistical tests and concepts presented in this article will help you to communicate more effectively with any statistician you work with.
Complete List of Best Practices for Analyzing Multiple Choice Surveys
1. Inferential statistical tests. To be more certain of the conclusions drawn from survey data, use inferential statistical tests. Only report conclusions about your whole population (not just the sample population) that are verified by inferential tests. The inferential tests should be taken seriously and should be documented alongside your survey data and analysis so that the validity of the conclusions can be adequately weighed by your peers who may want to build upon your work, and by the decision makers who may take actions based upon your results.
2. Confidence Level (CL). Choose your desired confidence level (typically 90%, 95%, or 99%) based upon the purpose of your survey and how confident you need to be of the results. Once chosen, don't change it unless the purpose of your survey changes. Because the chosen confidence level is part of the formula that determines the margin of error, it's also important to document the CL in your report or article where you document the margin of error (MoE).
3. Estimate your ideal sample size before you survey. Before you conduct your survey use a sample size calculator specifically designed for surveys to determine how many responses you will need to meet your desired confidence level with your hypothetical (ideal) margin of error (usually 5%). Use this pre-survey target sample size as a reality check on the effort that might be required to undertake the survey to get close to that ideal sample size. Do not assume that a small sample size will be sufficient. Smaller sample sizes result in larger margins of error. We recommend using the Raosoft sample size calculator at http://www.raosoft.com/samplesize.html for the analysis of multiple choice survey data.
4. Determine your actual margin of error after you survey. Use a margin of error calculator specifically designed for surveys (you can use the same Raosoft online calculator recommended above) with your real sample size after your survey is complete to ascertain the real margin of error for your sample data, given the confidence level you selected earlier. The actual margin of error will be critical in helping to determine the validity of your conclusions.
5. Use your real margin of error to validate your survey conclusions for your larger population. Add and subtract the margin of error from the percentage value of each survey question response, to compare the overlap between possible outcomes for your population as a whole. Use this range to determine if the result for your larger population is clear or if it is too close to call. If it is too close to call you can increase your sample size to reduce your margin of error, otherwise you must report that your survey was inconclusive for that question.
6. Apply the chi-square test to your crosstab tables to see if there are relationships among the variables that are not likely to have occurred by chance. Most survey analyses result in many crosstab tables, each of which will need to be tested separately. We recommend this very simple, free, online chi-square test calculator for the analysis of crosstab survey data, from T. Kirkman at the College of Saint Benedict and Saint John's University: http://www.physics.csbsju.edu/stats/contingency_NROW_NCOLUMN_form.html Or, for those of you ready to go to the next level, this free online calculator from Vassar University offers more options: from the home page at http://faculty.vassar.edu/lowry/VassarStats.html choose "Procedures Applicable to Categorical Frequency Data" then choose "Chi-Square, Cramer's V and Lambda for a Rows by Column Contingency Table".
The fine print: note that you need to use the frequency counts, not the percentage values, from each cell in your crosstab table in the calculator. Also, none of your table cells can have an expected frequency of zero (Byrne 2007), and if many of your cells have an expected frequency of less than five, the chi-square test may be invalid (Wildemuth 2009). If you have small cell sizes you may benefit from using Fisher's Exact Test instead, see the free online calculator for that at http://in-silico.net/statistics/fisher_exact_test.
7. Reading and reporting chi-square tests of cross-tab tables.
- Use the .05 threshold for your chi-square p-value results in cross-tab table analysis, particularly if the conclusions will be used to make high stakes decisions. However, if you consciously choose to use a different threshold, clearly state your reasons for doing so in your conclusions.
- If the chi-square p-value is larger than the threshold value, no relationship between the variables is detected. If the p-value is smaller than the threshold value, there is a statistically valid relationship present, but you need to look more closely to determine what that relationship is. Chi-square tests do not indicate the strength or the cause of the relationship.
- Always report the p-value somewhere close to the conclusion it supports (in parentheses after the conclusion statement, or in a footnote, or in the caption of the table or graph) when communicating with decision-makers or library peers. For example p=.035, or p < 0.001. Your readers need this information to assess the accuracy of your conclusions.
8. Document any known sources of bias or error in your sampling methodology and in your survey design in your report, including but not limited to how your survey sample was obtained.
References
Byrne, Gillian. 2007. A statistical primer: understanding descriptive and inferential statistics. Evidence Based Library and Information Practice [Internet]. [cited 2012 February 24]; 2(1):32-47. Available from: http://ejournals.library.ualberta.ca/index.php/EBLIP/article/view/168/239
Fisher's Exact Test. 2011. Joose's In-Silico Online. [Internet]. [cited 2012 February 24]. Available from: http://in-silico.net/statistics/fisher_exact_test
Ghaemi, S. Nassir. 2009. A Clinician's Guide to Statistics and Epidemiology in Mental Health: Measuring Truth and Uncertainty. Cambridge (UK): Cambridge University Press, p. 38.
Nardi, Peter M. 2003. Doing Survey Research: A Guide to Quantitative Methods. Boston: Allyn & Bacon, p.206.
Nielsen, Jakob. 2000. Why you only need to test with 5 users. Jakob Nielsen's Alert Box [Internet]. [cited 2012 February 24]. Available from: http://www.useit.com/alertbox/20000319.html
Nielsen, Jakob. 2006. Quantitative studies: how many users to test? Jakob Nielsen's Alert Box [Internet]. [cited 2012 February 24]. Available from: http://www.useit.com/alertbox/quantitative_testing.html
Raosoft Sample Size Calculator. 2004. Raosoft. [Internet]. [cited 2012 February 24]. Available from: http://www.raosoft.com/samplesize.html
Rubin, Allen. 2010. Statistics for Evidence-Based Practice and Evaluation, second edition. Belmont (CA): Brooks/Cole, p. 315, 316.
rxc Contingency Table: How Many Rows? How Many Columns? [Internet]. Kirkman, T.W. Statistics to Use; [cited 2012 February 24]. Available from: http://www.physics.csbsju.edu/stats/contingency_NROW_NCOLUMN_form.html
Salsburg, David. 2002. The Lady Tasting Tea: How Statistics Revolutionized Science in the Twentieth Century. New York (NY): Henry Holt and Company, LLC, p. 100.
Top Twelve Survey Best Practices. 2006. Constant Contact. [Internet]. [cited 2012 February 24]. Available from: http://img.constantcontact.com/docs/pdf/Top12SurveyBestPractices.pdf
VassarStats: Website for Statistical Computation. 2012. Lowry, Richard. [Internet]. [cited 2012 February 24]. Available from: http://faculty.vassar.edu/lowry/VassarStats.html
Wildemuth, Barbara M. 2009. Applications of Social Research Methods to Questions in Information and Library Science. Westport (CT): Libraries Unlimited, p. 350, p. 116-128.
| Previous | Contents | Next |
